
Figure 2.
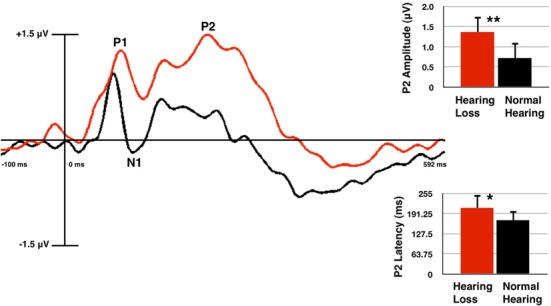
Grand averaged cortical auditory evoked potentials (CAEPs) from the frontal region of interest (ROI) for the normal hearing (NH, in black) and hearing loss (HL, in red) groups. P2 amplitude is significantly higher and P2 latency is significantly longer in the HL group as shown in the waveform and mean amplitude bar graphs. Two asterisks indicate significance at p < 0.01, one asterisk indicates significance at p < 0.05. Vertical bars on the graph show standard deviation.