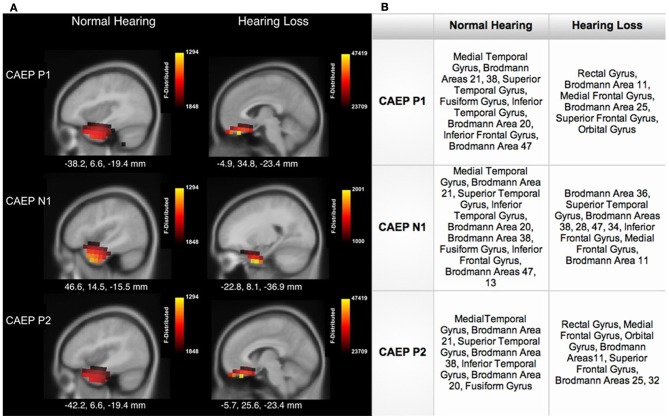
Figure 4.
(A) Current density reconstructions (CDR) showing cortical activation at the P1, N1, and P2 CAEP peak components on sagittal MRI slices for the normal hearing (NH) and hearing loss (HL) groups. The scale of the F Distribution is shown in the upper right corner ranging from red to yellow (yellow is highest level of activation), and the Montreal Neurological Institute (MNI) coordinates are listed below each MRI slice. (B) A table describing activated anatomical cortical areas for the CAEP components for each group, listed in approximate order of highest level of activation.

