
Figure 5.
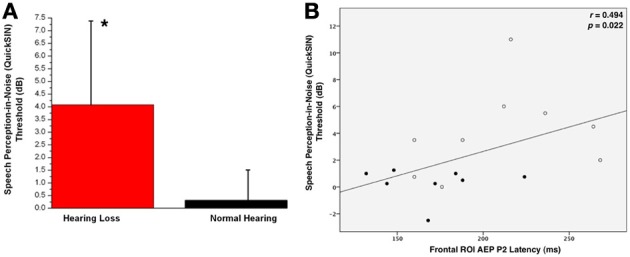
(A) Mean QuickSIN™ scores for normal hearing (NH, in black) and hearing loss (HL, in red) groups. Standard deviations are shown as vertical bars. One asterisk reflects a significant difference at p < 0.05. (B) The correlation of the CAEP P2 component latency as a function of QuickSIN™ scores. The Spearman's rank order correlation coefficient value and significance level are indicated in the right upper corner.