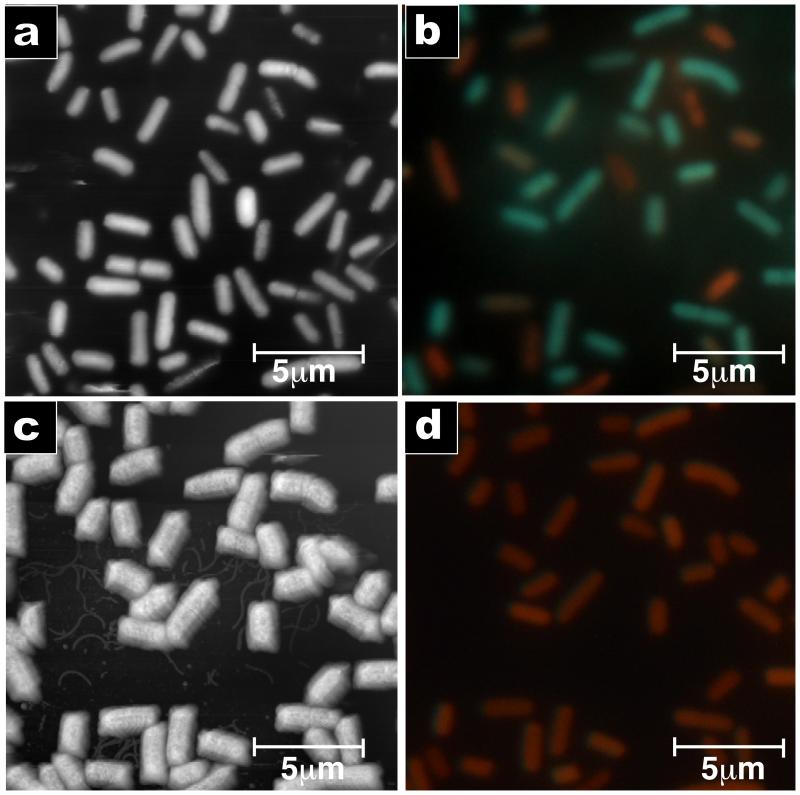
Figure 3. AmP-induced surface morphology change correlates to cell death.
Combined AFM and fluorescence microscopy images recorded on the same spot before and after addition of CM15. A) Tapping mode image of bacteria before addition of CM15 (phase data). The surfaces of most bacteria are smooth. B) Fluorescence image before addition of CM15. Green represents live bacteria; red represents dead bacteria (LIVE/DEAD stain). C) AFM image 30 minutes after exposure to a 2 times the MIC solution of CM15. Nearly all the bacteria exhibit a corrugated surface. D) Fluorescence image after addition of CM15. All bacteria are red, indicating that they are dead. AFM images were taken with 512 × 256 pixels and a scan rate of 0.5 Hz.

