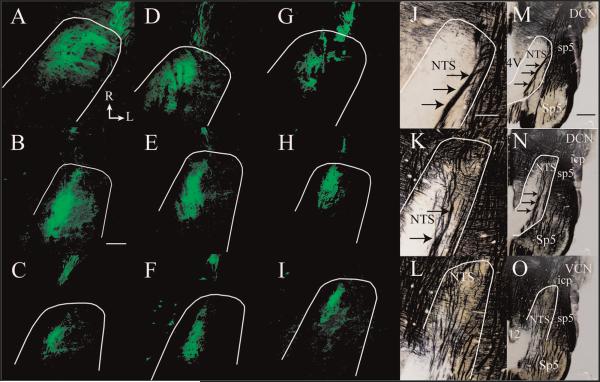
Figure 3.
Horizontal sections of labeled CT terminal field (green) from the dorsal through the ventral zones of the rostral NTS. Fluorescent photomicrographs of labeled CT terminal field in a control rat (A–C), 7 days post-CTX rat (D–F), and 60 days post-CTX rat (G–I). The approximate location of NTS is outlined in white. Myelin-stained brainstem sections (Schmued and Slikker, 1999) from a control rat are shown in J–L at a similar magnification as shown for A–I and in a lower magnification in M–O to illustrate the brainstem landmarks characteristic of dorsal through ventral zones, representing zones B–D, respectively (see text). The location and size of landmarks did not differ qualitatively among groups. Arrows point to the solitary tract in J, K, M, and N. Rostral (R) and lateral (L) are indicated in A. 4V, fourth ventricle; 12, hypoglossal nucleus; DCN, dorsal cochlear nucleus; icp, inferior cerebellar peduncle; NTS, nucleus of the solitary tract; Sp5, spinal trigeminal nucleus; sp5, spinal trigeminal tract; VCN, ventral cochlear nucleus. Scale bars = 200 μm in B (applies to A–I); 200 μm in J (applies to J–L); 1 mm in M (applies to M–O).

