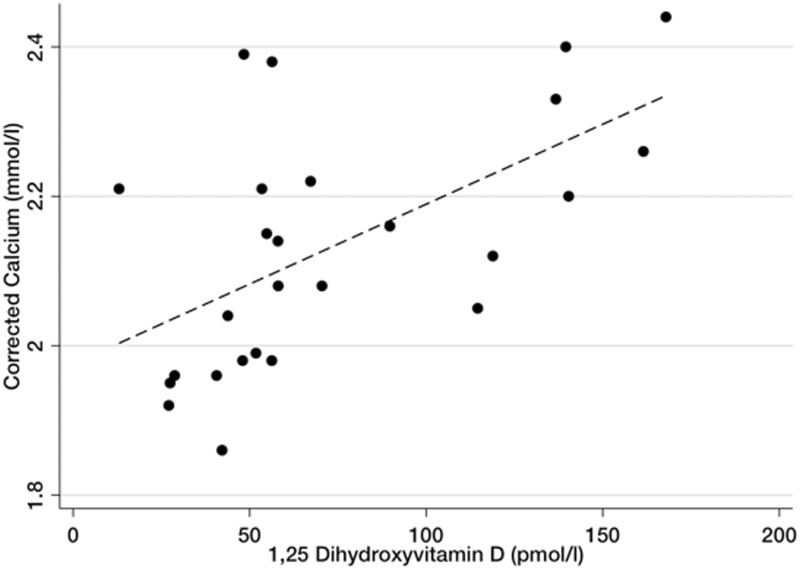
Figure 3.
Relationship of plasma calcium and 1,25 dihydroxyvitamin D concentrations. Scatterplot and linear regression demonstrating the correlation of plasma corrected calcium and 1,25 dihydroxyvitamin D (r2 = 0.79, P = 0.0001, β-coefficient = 0.002). Values represent measurements for all patients from pre-treatment until immediately after the final plasma exchange.

