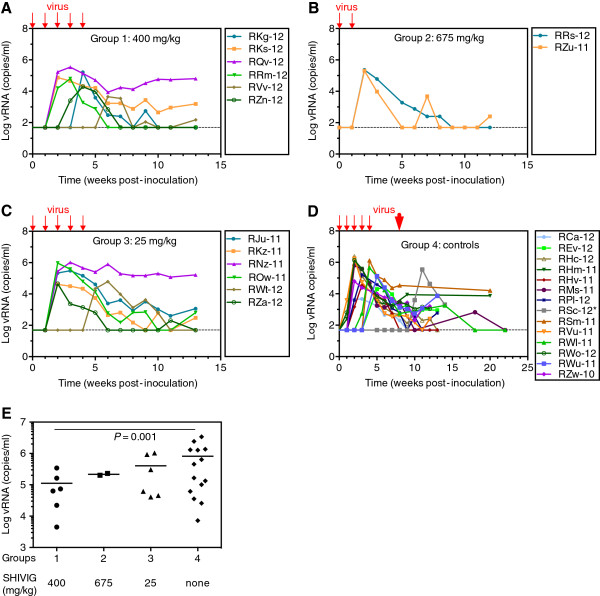
Figure 4.
Plasma viral RNA (vRNA) loads after SHIV-2873Nip challenges. A-D. Graphs represent vRNA loads after viral challenges for Group 1–4, respectively. Small red arrows indicate 5 low-dose SHIV-2873Nip challenges. Animals in Group 2 B became infected after the second viral challenge and further challenges were omitted. D. Virus-only controls. Three animals from this group could not be challenged at week 4 (inclement weather forced closure of the primate center) and one RM (*RSc-12) became viremic only after the high-dose challenge (30,000 TCID50) at week 7 (large red arrow). During the 2-week interval between the 4th and 5th low-dose challenge, this RM had developed SIV Gag-specific proliferative responses (data not shown). E. Statistical analysis of the peak of vRNA loads. The dashed line represents the limit of detection (50 copies/ml). For control Group 4, peak vRNA load was calculated including the animals with protocol breach. Peak viremia levels were compared using negative binomial regression, in order to adequately model the non-normality of the observed peak levels. Raw p-values from pair-wise comparisons with the control group were adjusted using Dunn’s method.

