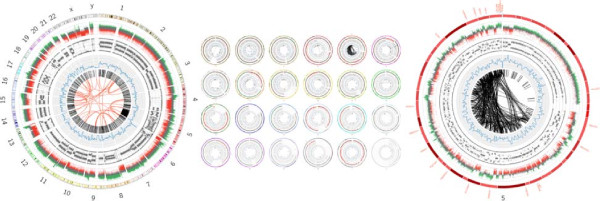
Figure 2.

Circos integrative plot tool. Circos plots for (left) whole genome, (middle) overview or all chromosomes in single images, and (right) for a single chromosome. Each chromosome is represented in the outer ring and then from outer to inner rings represent copy number variation (with regions of gain depicted in green and loss in red), B-allele frequency, SNP density and the intra- and interchromosomal rearrangements are on the inside and depicted in black and red lines, respectively. Impacted genes track (red gene symbols) are displayed outside the outer chromosome ring and only on the single chromosome plot.
