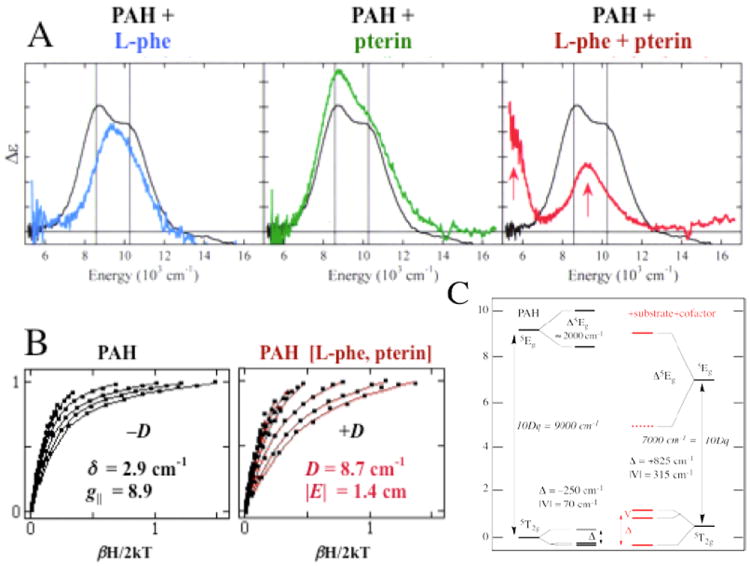
FIGURE 3.

MCD studies of PAH. (A) MCD spectra of resting PAH (black) with substrate-bound (blue), pterin-bound (green) and substrate/pterin-bound (red). All spectra were collected at 5 K. (B) VTVH MCD data for resting (left) and substrate/pterin-bound (right) PAH. (C) Derived d-orbital energy level diagrams.
