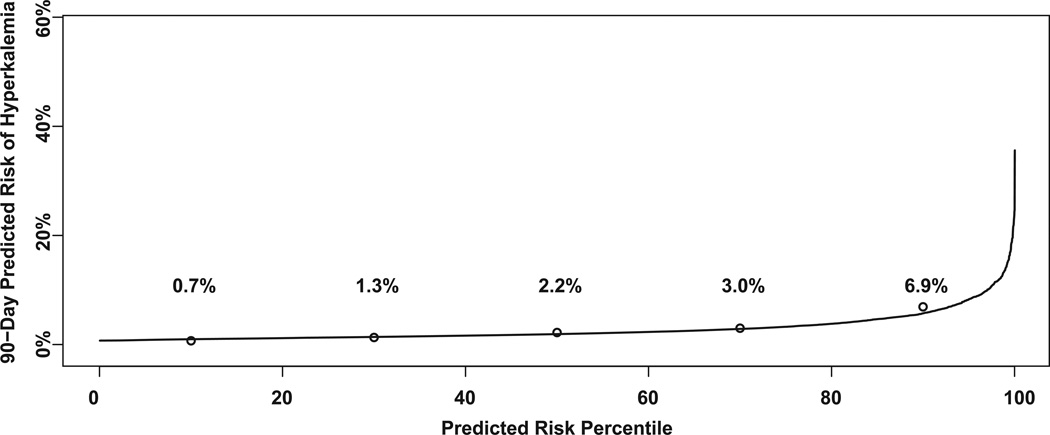
Figure.
The risk predictiveness curve (solid line) shows patients’ (n=5,171) predicted risk of hyperkalemia according to the risk score based on the following characteristics: age, eGFR, diabetes, heart failure, starting dose of lisinopril, current use of potassium supplements, and current use of potassium-sparing diuretics. Within each quintile of predicted risk, noted on the x-axis, the open circles show the observed risks of hyperkalemia. The risk score’s accuracy (calibration) is measured by the agreement between the predicted and observed risks.

