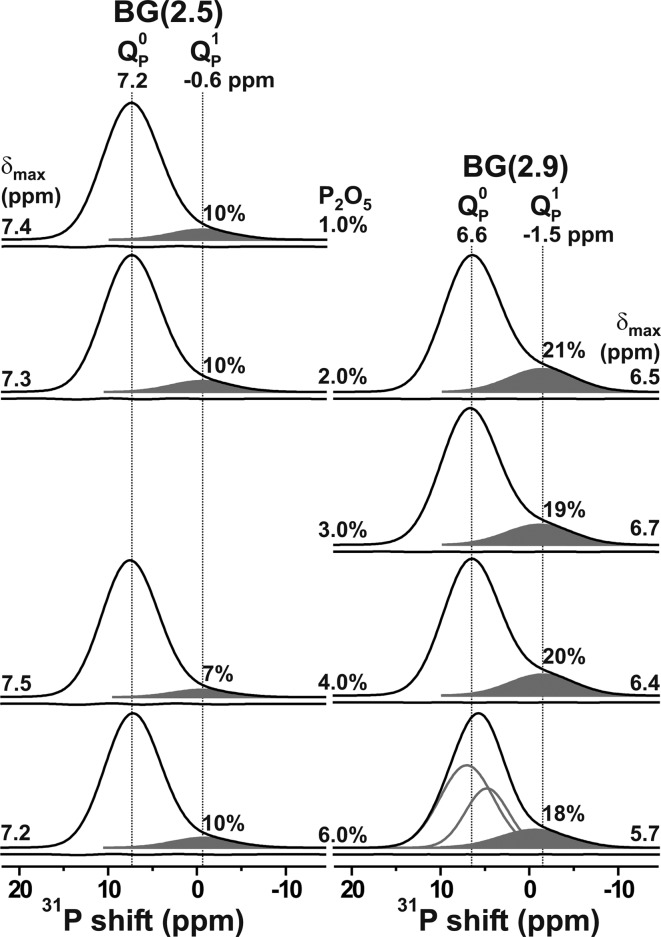
Figure 1.
Experimental 31P MAS NMR spectra recorded from Na2O–CaO–SiO2–P2O5 glasses, where the BG(2.5) and BG(2.9) series are displayed in the left and right columns, respectively, and ordered according to increasing P2O5 contents from top to bottom. The peak maximum is specified at the outermost portion of each spectrum; it is mainly dictated by the 31P resonances from QP0 groups, whose traces are not indicated, except for the NMR spectrum from BG6.0(2.9) that required deconvolutions into two distinct 31P signals. Shaded areas mark signal contributions from QP moieties, whose relative populations (in %) are indicated. The curve beneath each spectrum reveals the difference between the experimental and best-fit spectra.

