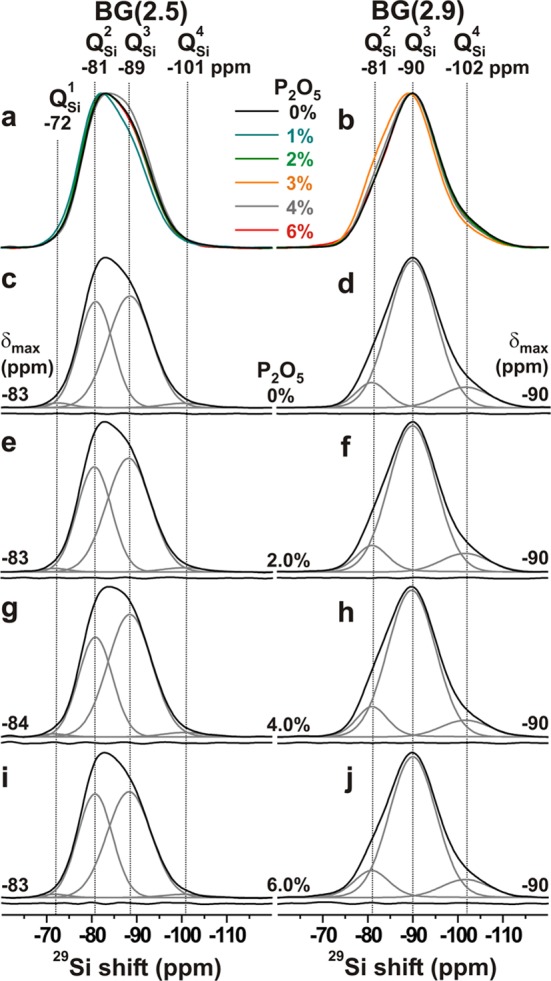
Figure 3.

29Si MAS NMR spectra obtained from the BG(2.5) (left column) and BG(2.9) (right column) series of glasses. (a, b) Superimposed NMR spectra associated with the as-indicated glasses. (c–j) Experimental spectra (black traces) displayed together with deconvoluted peak-components (gray traces). They are assigned at the top of each column. The curves beneath the spectra constitute differences between experiments and best-fits.
