
Figure 5.
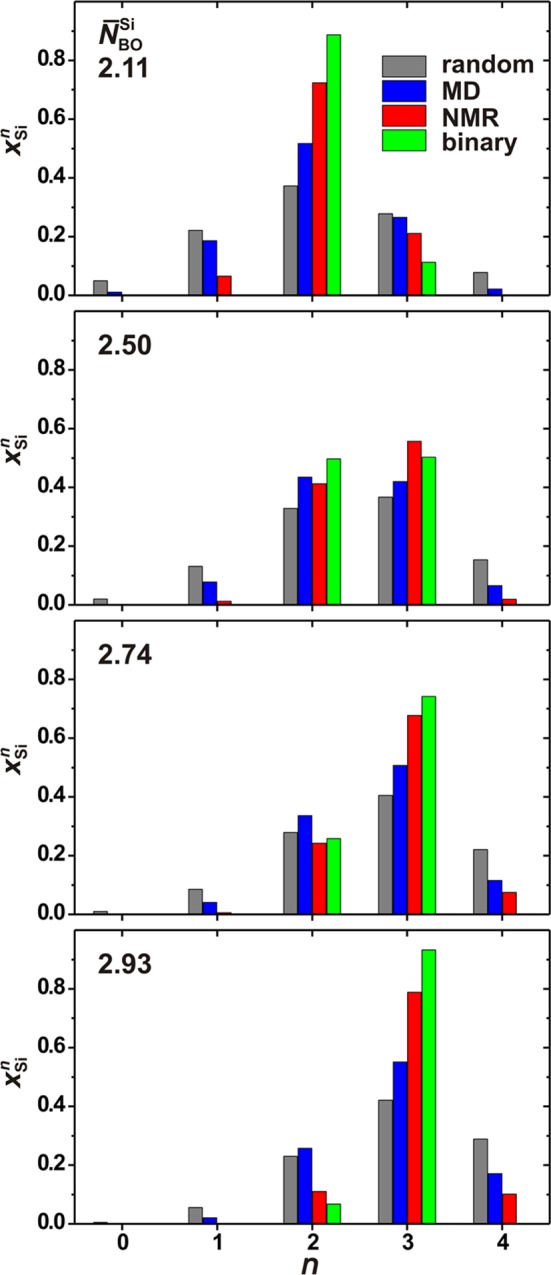
QSin fractional populations determined either by 29Si NMR or MD simulations and plotted versus the number of BO atoms (n) at the SiO4 group. For the glass series BG(2.5) and BG(2.9) that comprise several samples, the {xSi} values represent averages over all members within the series. The results are compared with the predictions from binary and random NBO/BO distributions (calculated from the expressions of ref (21)) for each as-indicated N̅BOSi(nom) value.