
Figure 6.
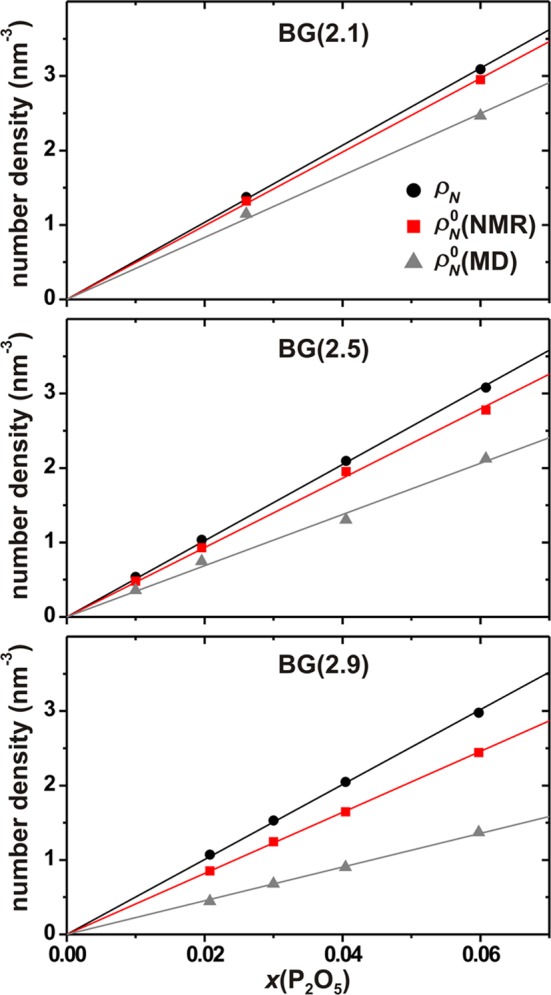
Number density (number of species per nm3) of P atoms (ρN) and orthophosphate groups (ρN0), plotted against the molar fraction of P2O5 for the as-indicated BG(N̅BO) series of glasses. ρN was obtained from the stoichiometric glass composition and its accompanying experimental density ρ (see Table 1), whereas ρN0 = xPρN involves the fractional population xP0 obtained either by 31P NMR or by MD simulations. Straight lines represent best-fit results.