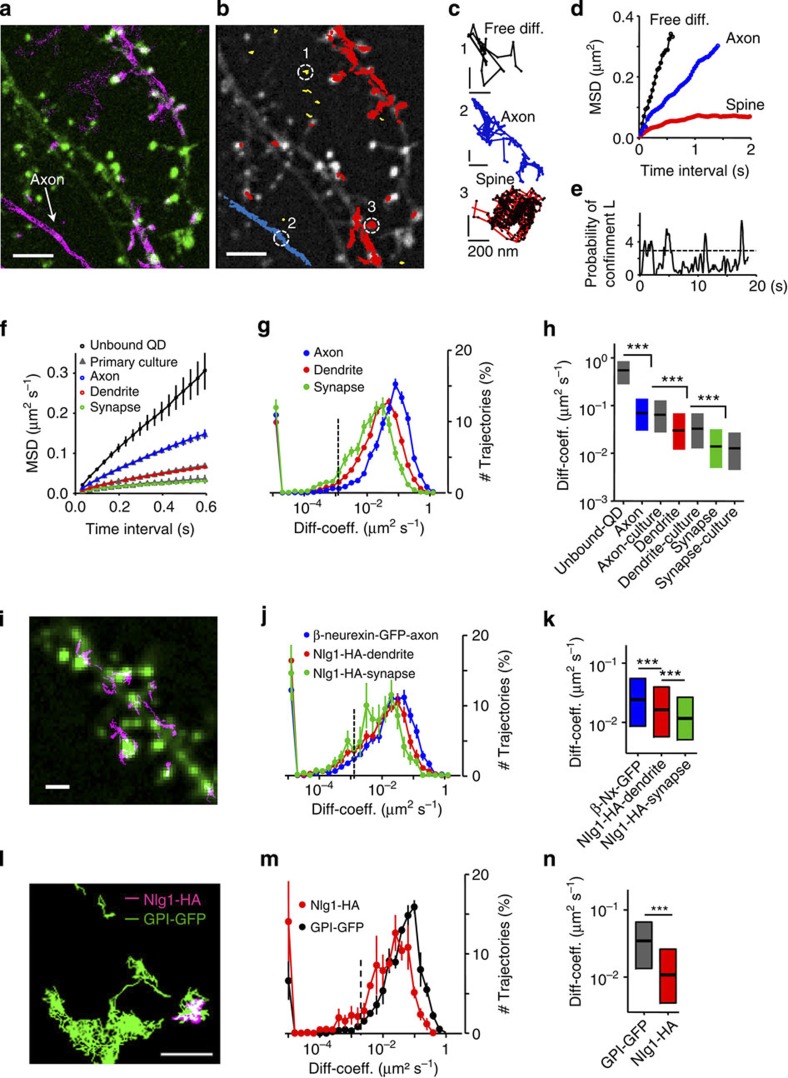
Figure 3. QD dynamics in membrane compartments.
(a) Image of dendrites expressing Homer1C-DsRed (green) and GPI–GFP (magenta). Positions of anti-GFP QDs, unspecific QDs are detected outside labelled neurits. (b) Individual trajectories of GPI molecules (red, dendrite; blue, axonal; yellow, extracellular), scale bar,10 μm (a,b). (c) Exemplary trajectories from b: unbound QD (black), axonal (blue) and spine (red); scale bar, 200 nm. (d) MSD for trajectories in c. (e) Probability of confinement for spine trajectory, dotted line indicates level above which particles are considered to be confined. (f) MSD for unbound (black), axonal (blue), dendritic (red) and synaptic (green) trajectories, corresponding data from cultured neurons are similar (grey triangle). Data are means±s.e.m., n trajectories of >29 time points are included from 115 unbound QDs, 246/349 axonal slice/primary culture, 580/483 dendritic and 540/71 synaptic trajectories (72 slices (10 slice cultures), 10 cells (3 cultures)). (g) Distribution of diffusion coefficients (D) within subcellular compartments (axons, blue; dendrites, red; synapses, green). Data represented as mean±s.e.m., 21,390 trajectories, 72 slices, 10 slice cultures. (h) Mobile fraction of GPI–GFP within different subcellular compartments as median and IQR, differences between axons, dendrites and synapses were tested by the Kruskal–Wallis test followed by a Dunn’s multiple comparison test, ***P<0.0001, data are from 89 unbound QD, 2880/828 axon slice/culture, 7,690/994 dendrite and 2,425/282 synapse trajectories. (i) Dendritic segment, transfected with Homer1C–GFP (green) and trajectories of anti-HA-QD-labelled Nlg1-HA (magenta). (j) Distribution of D of Nlg1-HA dendrites (red), synapses (green), β-neurexin–GFP axons (blue); error bars represent±s.e.m., data from 27 slices, 5 slice cultures. (k) Mobile fraction of Nlg1-HA and β-neurexin–GFP, median and IQR; differences were tested by the Kruskal–Wallis and Dunn’s multiple comparison test, ***P<0.0001, Nlg1-HA trajectories: 1,987 dendritic, 569 synaptic; β-neurexin trajectories: 2,529 axonal. (l) Exemplary trajectories of GPI–GFP (green) and Nlg1-HA (magenta) at co-transfected neuron, scale bars, 1 μm (i–l). (m) Distribution of D for Nlg1-HA (red) and GPI–GFP (black). (n) Mobile fraction of Nlg1-HA and GPI–GFP, median and IQR, data in m and n include 607 trajectories for Nlg1-HA, 1,221 for GPI–GFP, 7 slices, 5 slice cultures; differences were tested by the Mann–Whitney test, ***P<0.0001.

