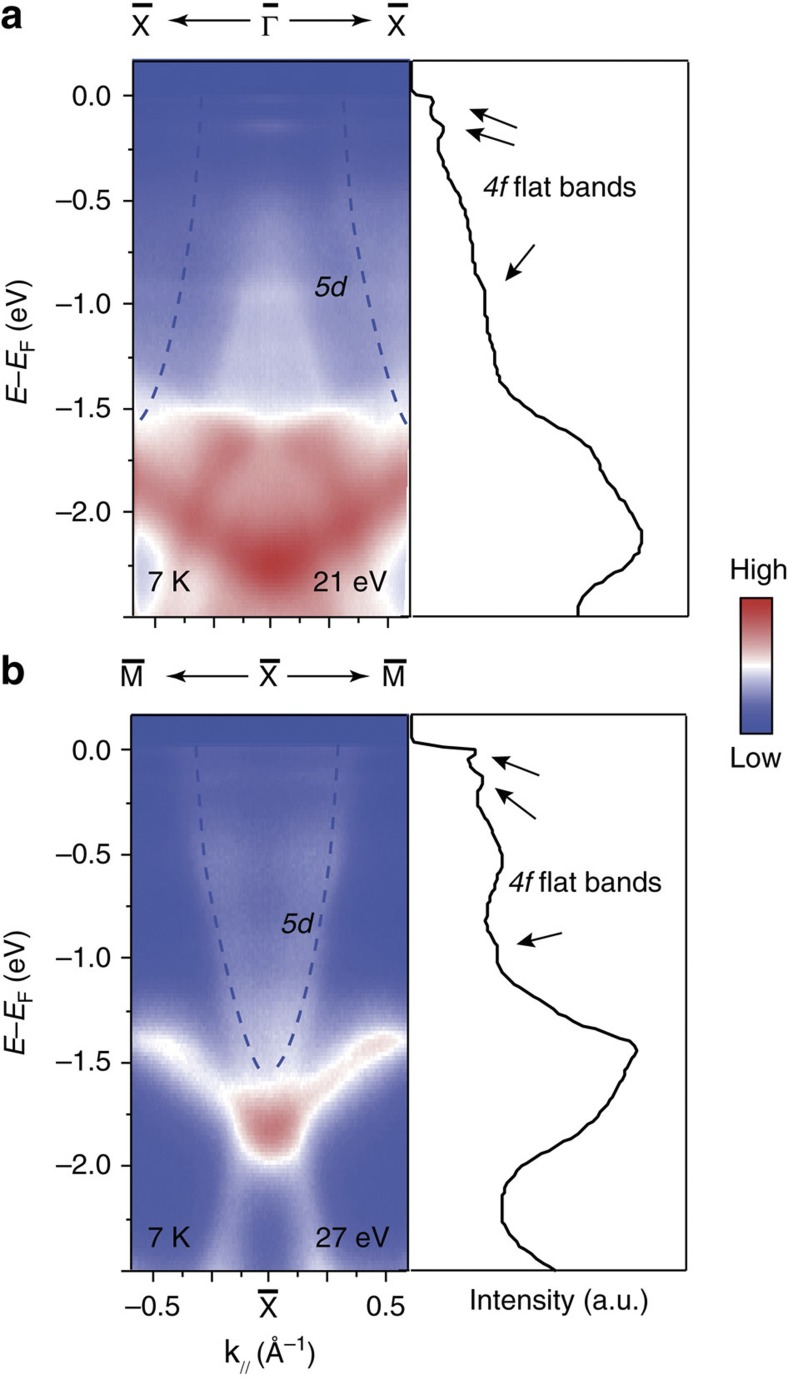
Figure 2. Valence band structure of SmB6.
(a,b) Left panel: large energy scale photoemission intensity plot along the  –
– and
and  –
– directions, respectively. Right panel: integrated EDCs to highlight the positions of the flat 4f bands as marked by the arrows. Dashed lines in panels a and b indicate the Sm 5d band that crosses EF at high temperatures. Data were taken at 7 K with 21 and 27 eV photons, respectively, at Stanford Synchrotron Radiation Lightsource.

