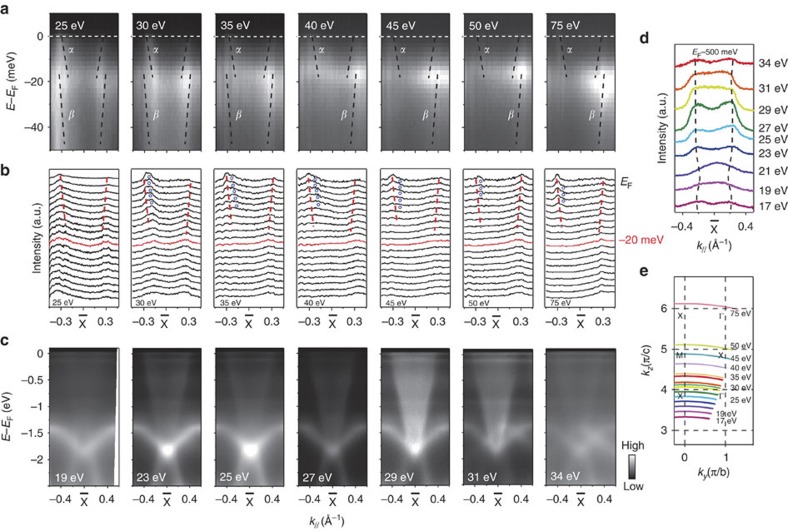
Figure 4. Photon energy dependence of the in-gap state around  .
.
(a) Photon energy dependence of the photoemission intensity measured along cut #4 shown in Fig. 2a. The α and β band dispersions are indicated by the dashed lines. The bright regions correspond to the location where the 4f and 5d bands hybridize, which are particularly strong at some photon energies due to matrix element effects. Data were taken at 1 K at BESSY II. (b) The corresponding MDC plots of panel a. The red dashed lines are dispersions tracked from the MDC peak in the 25-eV data, and they are overlaid on data taken at other photon energies, indicating the lack of photon energy dependence. The blue circles refer to the shoulders in the MDCs that might be contributed by the bulk band. (c) The photoemission intensity measured along cut #1 in Fig. 2a for various photon energies. Data were taken at 7 K at Stanford Synchrotron Radiation Lightsource. (d) MDCs at −500 meV for data in panel c. (e) The sampled momentum cuts for various photon energies calculated with the inner potential 14 eV following ref. 10, indicating that the photon range that we used cover an extended Brillouin zone in kz.

