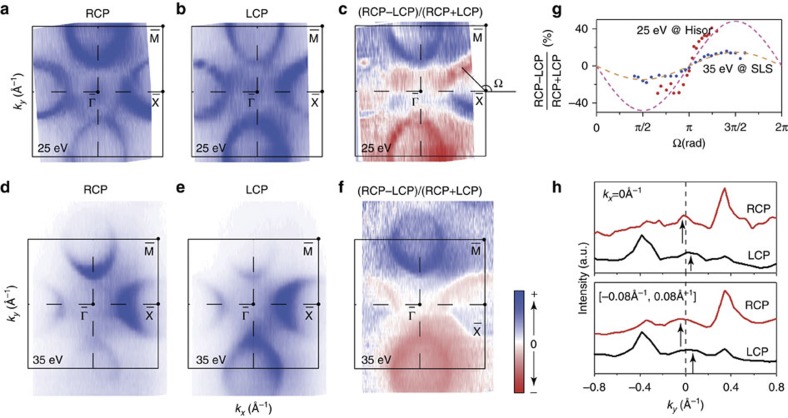
Figure 5. CD of the surface states at  and
and  .
.
(a,b) Fermi surface maps of SmB6 taken with right circularly polarized (RCP) and left circularly polarized (LCP) light, respectively. The intensity was integrated over a window of (−5 meV, +5 meV). The data were taken at 8 K with 25 eV photons at Hiroshima Synchrotron Radiation Center (HiSOR). (c) The differential map of the RCP and LCP photoemission intensities in panels a and b that are normalized to their sum intensity. (d–f) The same as in panels a–c, but for another SmB6−x sample with a slight boron deficiency. The intensity was integrated over a window of (−10 meV, +10 meV) and the data were taken at 27 K with 35 eV photons at Swiss Light Source. Note the γ band is not so visible here, probably because of its negligible matrix element at this photon energy. (g) The CD values taken along the right pocket in panel c (red dots) and in panel f (blue dots), where the polar angle Ω is defined within panel c with respect to  . The dashed curves are sine function fits of the experimental data. (h) Top: the two MDCs along ky taken at EF and kx=0 with RCP and LCP light, respectively, where the CD of the γ band are indicated by the arrows. Bottom: analogous to the top except that the data are integrated over a kx window of (−0.08 Å−1, 0.08 Å−1) to cover the γ pocket. The data were taken at 8 K with 25 eV photons at HiSOR.

