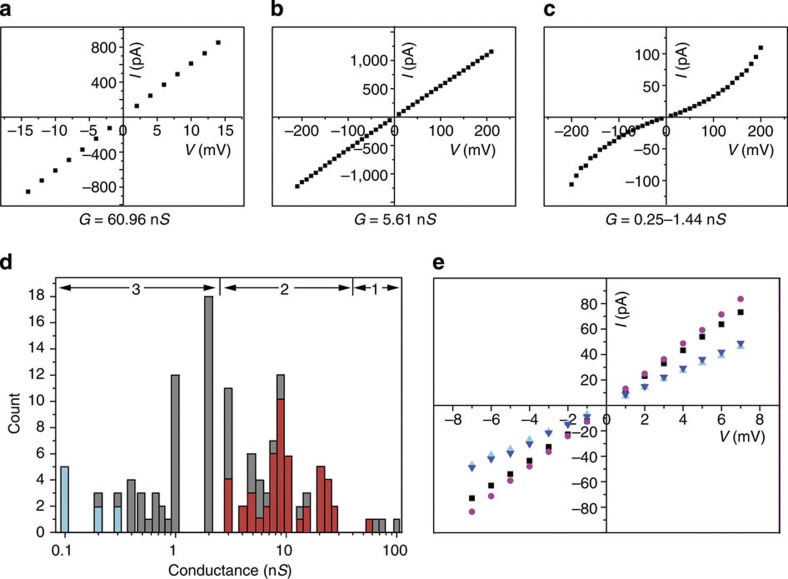
Figure 2. Categorization of SWCNT nanopores.
(a–c) Representation of I–V curves and conductance value of a SWCNT nanopores of group 1–3, respectively. Data were acquired in the buffer of 1 M KCl and 10 mM Tris, pH 8.0. (d) Conductance distribution of SWCNT nanopores categorized in three groups 1–3. The SWCNTs that passed ssDNA molecules are marked in red (the unmarked tubes in group 2 were not tested for DNA translocation). The SWCNTs that showed nonlinear I–V curves are marked in turquoise. (e) I–V curves of a SWCNT nanopore in group 2 under four different pH conditions (pH 10.0, circle; pH 8.0, square; pH 3.44, inverted triangle; pH 2.89, triangle). The experiments were repeated in six different SWCNT nanopores.

