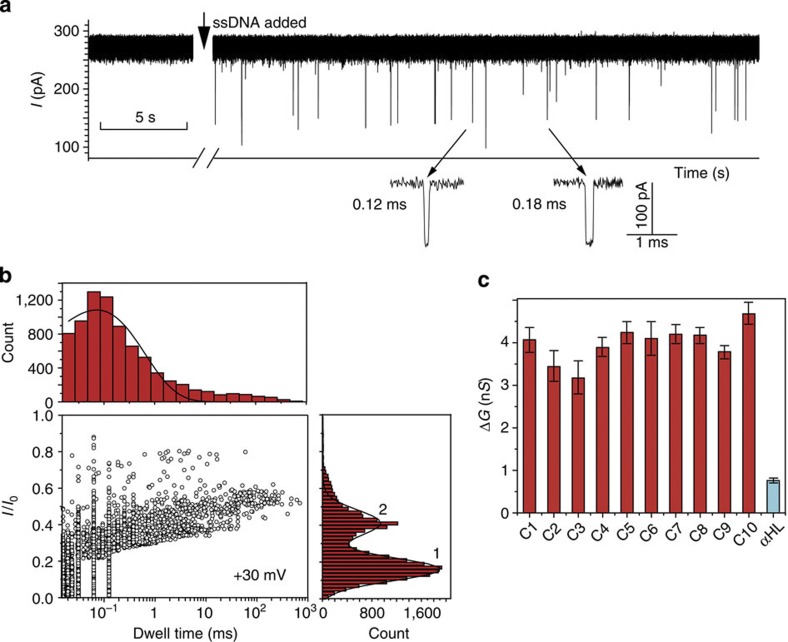
Figure 3. Translocation of ssDNA through SWCNT nanopores.
(a) Typical ionic current signal recorded when DNA1 (final concentration 1.0 μM) was added to the cis side of a SWCNT nanopore (GCNT=8.97 nS). The capture rate is ∼2,300 events per h. Data were acquired in the buffer of 1 M KCl and 10 mM Tris, pH 8.0, with the transmembrane potential held at +30 mV. (b) Scatter plot of the events (normalized current blockage I/I0 versus event durations) in a. The dwell-time histogram was constructed using the data points with I/I0>0.3. The solid line in dwell-time histogram is a mono-exponential fit to the data. Peak 1 in I/I0 histogram represents SWCNT–DNA colliding events and peak 2 represents DNA translocation events. The lines on peaks 1 and 2 are Gaussian fit to the histogram. (c) Comparison of conductance change values (ΔG) of DNA translocation through SWCNT nanopores (C1–10) and αHL. The error bars are defined as s.d. of at least three experiments. The conductance values of the nanopores are as follows: GCNT (1–10) 8.30, 8.39, 8.54, 8.65, 9.63, 16.41, 16.75, 24.59, 25.28 and 60.75 nS; GαHL=0.93 nS.

