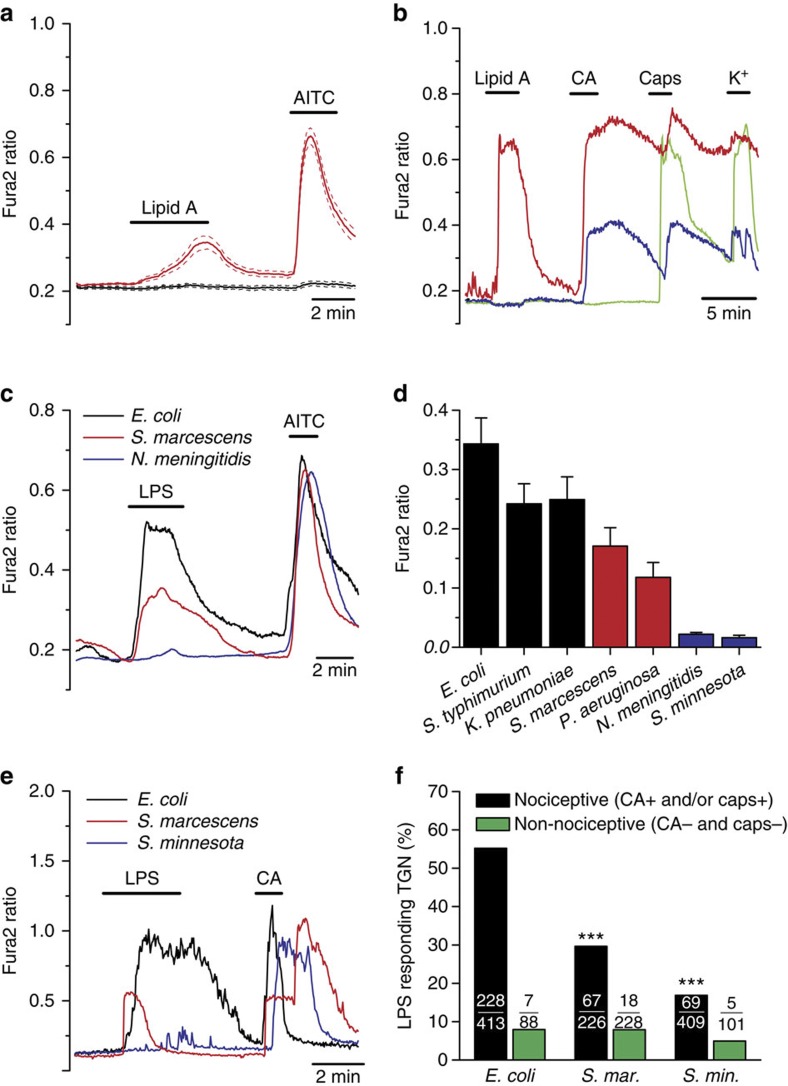
Figure 5. The shape of lipid A determines TRPA1 activation by LPS.
(a) Ratiometric [Ca2+]i imaging experiment showing the effect of extracellular application of lipid A on CHO mTRPA1 cells. Thirty-six percent of the TRPA1-expressing cells (AITC-sensitive) responded to lipid A (red traces, n=50). Non-transfected cells (black traces) did not respond to lipid A (n=20). Solid and broken traces represent mean and ±s.e.m., respectively. (b) Representative responses of mouse nodose neurons to lipid A, CA (100 μM), capsaicin (1 μM) and high K+ (30 mM). A fraction of CA-sensitive neurons was also activated by lipid A. (c) Mean [Ca2+]i elevation evoked by LPS extracted from E. coli, S. marcescens and N. meningitidis (20 μg ml−1) in mTRPA1 cells (n>25 for each trace). (d) Average±s.e.m. amplitude of [Ca2+]i evoked by LPSs with different lipid A conformation in mTRPA1 cells (n=26–129). (e) Representative examples of responses in TG neurons to different types of LPS. (f) Percentage of TG neurons responding to different types of LPS. In nociceptive neurons, responses to S. marcescens and S. minnesota LPS were significantly reduced (***P<0.001) compared with E. coli (Fisher’s exact test). In non-nociceptive neurons, responses were not different.

