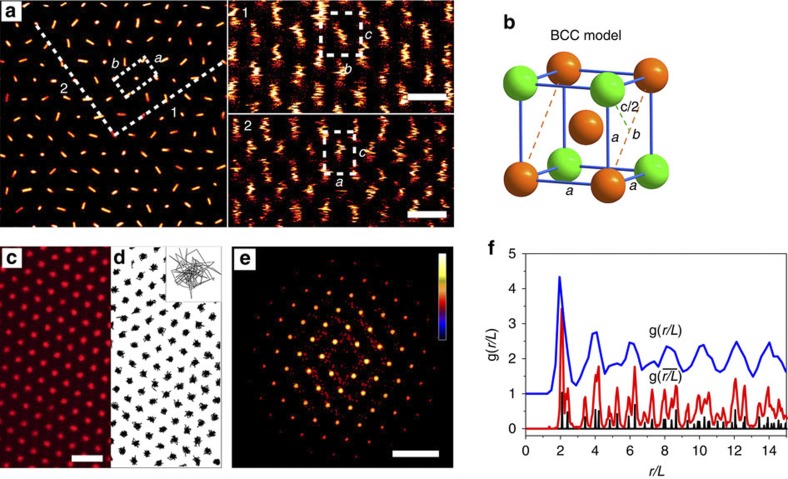
Figure 1. Body centred cubic plastic crystal structure.
Silica rods R1 with ϕ=0.005. (a) Confocal images of a BCC plastic crystal, left: (110) plane; top right: (001) plane; bottom right: (10) plane. The images for the (001) and (10) planes were reconstructed from the same x-y-z stack. (b) Schematic BCC model defining the lattice vectors shown in (a) and (b). (c) The average of 150 frames was measured over a time of 300 s. (d) The corresponding trajectories of particle centres during that time; the inset highlights the trajectory of a single rod. (e) Fourier transform calculated from the monochrome real space image of (c) and (d). The colour bar indicates the logarithmic intensity scale. (f) Pair correlation function g(r) found, from top to bottom, by calculating the g(r) of a single frame, by calculating the g(r) of the average of 150 frames, and from a perfect BCC lattice. The scale bars in (a) and (c) represent 10 μm, and in (e) represents 0.628 μm−1.

