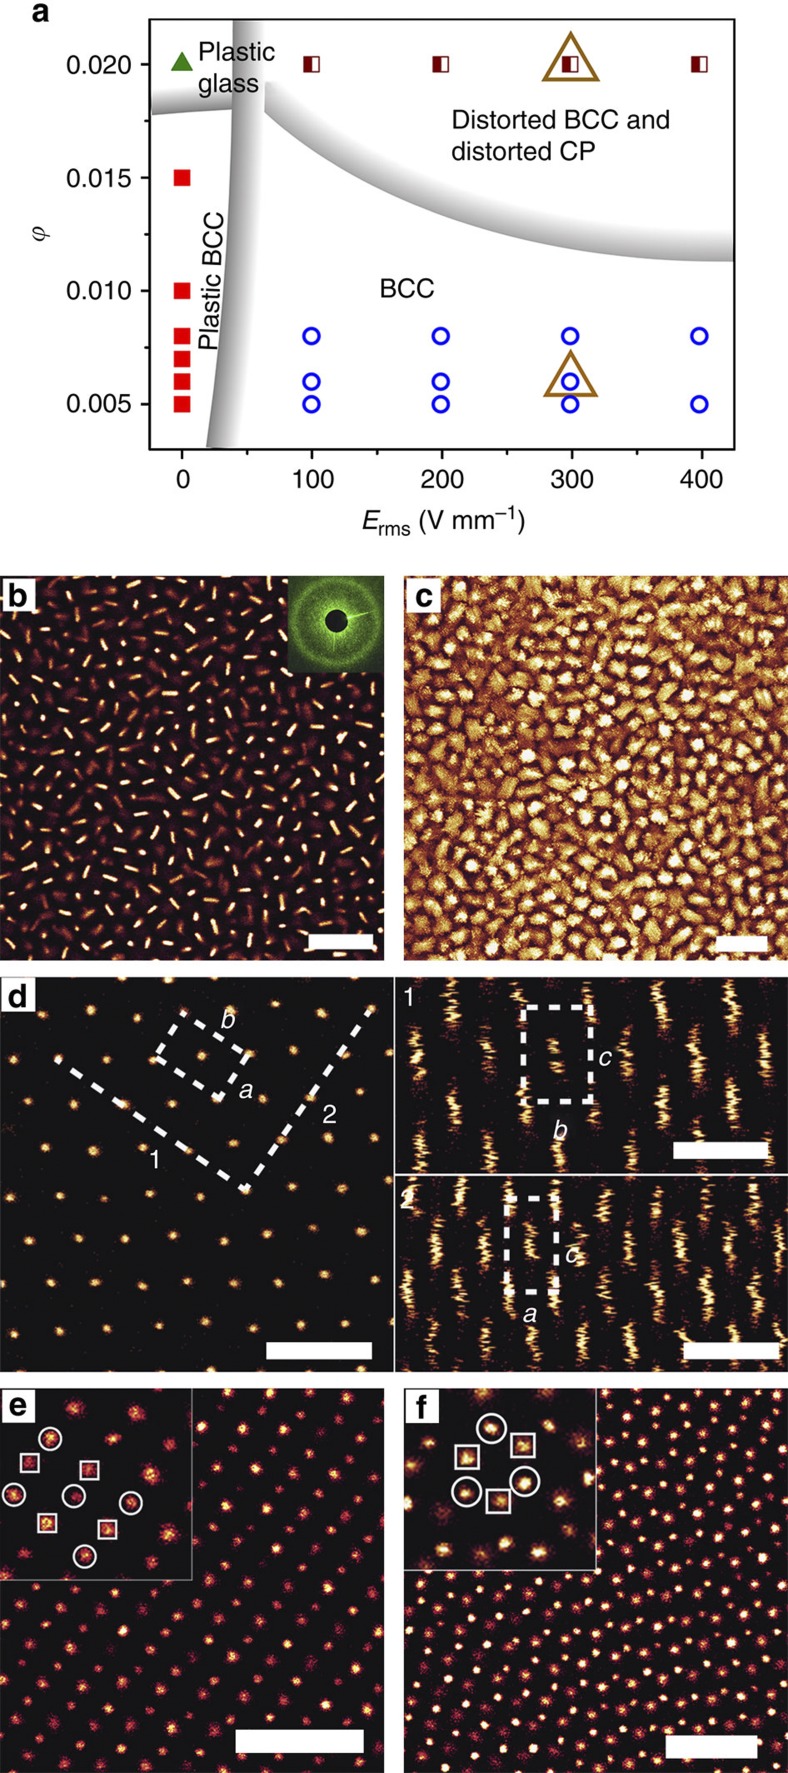
Figure 3. Volume fraction-electric field phase diagram.
Silica rods R2 with ϕ=0.005~0.02. (a) The phase diagram. Thick grey lines indicate approximate phase boundaries. (b) Confocal image of a plastic glass phase; inset shows a 3D laser diffraction pattern. (c) A superposition of 120 frames of plastic glass measured over 98 s. (d) Confocal images of a fully BCC phase, left: (110) plane; top right: (001) plane; bottom right: (10) plane. The images for the (001) and (10) planes were reconstructed from the same x-y-z stack. (e) Distorted BCC phase and (f) distorted close packed phase at ϕ=0.02, the focal plane is in between two neighbouring layers. In inset images, squares represent one layer, and circles represent one neighbouring layer. The scale bars from (b) to (f) represent 10 μm.

