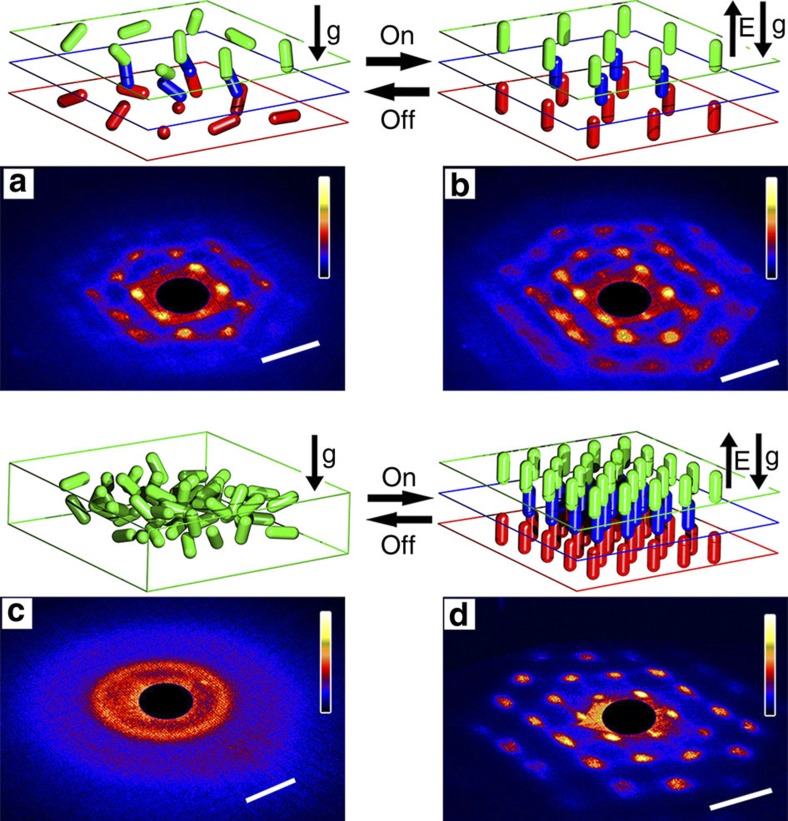
Figure 5. Laser diffraction patterns of crystal switching.
The field was perpendicular to the projection plane. Silica rods: R2. (a) Plastic crystal and (b) fully crystalline state of the silica rods at ϕ=0.006, see the highlight with a triangle in Fig. 3a; (c) plastic glass and (d) a fully crystalline state of the silica rods at ϕ=0.02, see the highlight with a triangle in Fig. 3a. The scale bar is 2 cm. The projection plane was ca. 11 cm behind the sample. The color bar indicates the scattering intensity scale.

