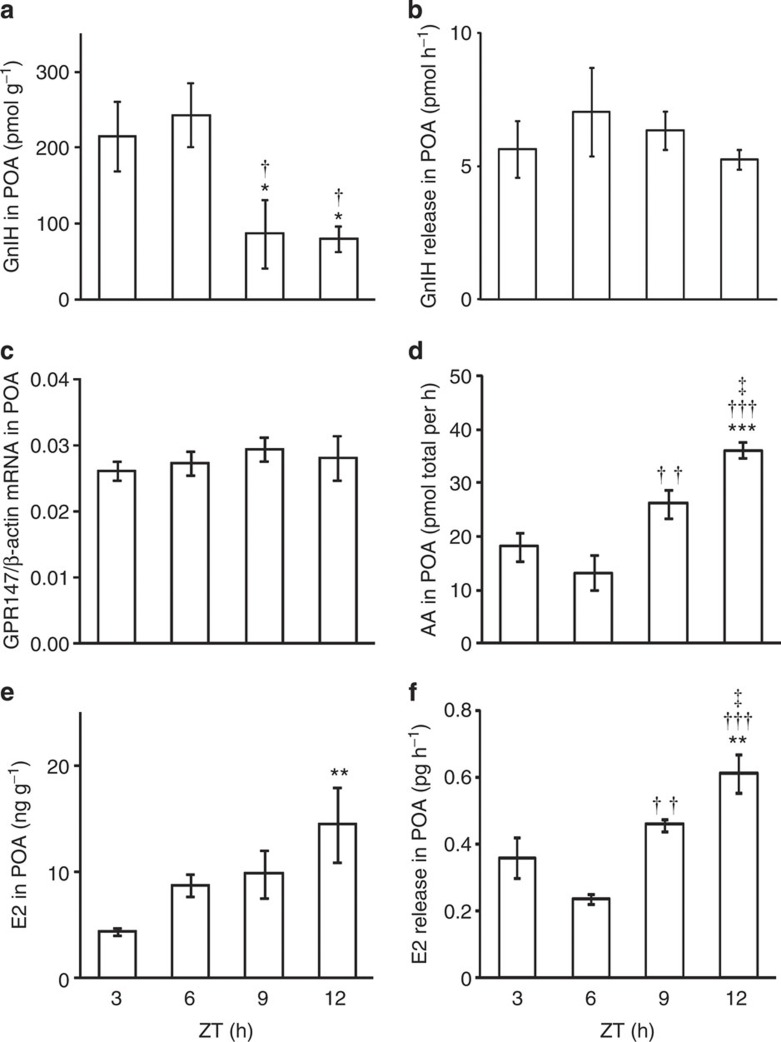
Figure 5. Diurnal changes in GnIH content and release and GnIH receptor mRNA expression and AA and E2 content and release in the POA.
(a) Diurnal changes in GnIH concentration in the POA. The columns and the vertical lines represent the mean±s.e.m. (n=4). DOF=15, F=4.7, P=0.022 by one-way ANOVA; *P<0.05 versus ZT 3, †P<0.05 versus ZT 6 by Fisher’s PLSD. (b) Diurnal changes in GnIH release in the POA. The columns and the vertical lines represent the mean±s.e.m. (n=3). (c) Diurnal changes in GnIH receptor (GPR147) mRNA expression in the POA. The columns and the vertical lines represent the mean±s.e.m. (n=4). (d) Diurnal changes in AA in the POA. The columns and the vertical lines represent the mean±s.e.m. (n=4). DOF=15, F=14, P=0.00029 by one-way ANOVA; ***P<0.001 versus ZT 3, ††P<0.01, †††P<0.001 versus ZT 6, ‡, P<0.05 versus ZT 9 by Fisher’s PLSD. (e) Diurnal changes in E2 concentration in the POA. The columns and the vertical lines represent the mean±s.e.m. (n=5). DOF=19, F=3.8, P=0.032 by one-way ANOVA; **P<0.01 versus ZT 3 by Fisher’s PLSD. (f) Diurnal changes in E2 release in the POA. The columns and the vertical lines represent the mean±s.e.m. (n=3). DOF=11, F=14, P=0.0016 by one-way ANOVA; **P<0.01 versus ZT 3, ††P<0.01, †††P<0.001 versus ZT 6, ‡P<0.05 versus ZT 9 by Fisher’s PLSD.

