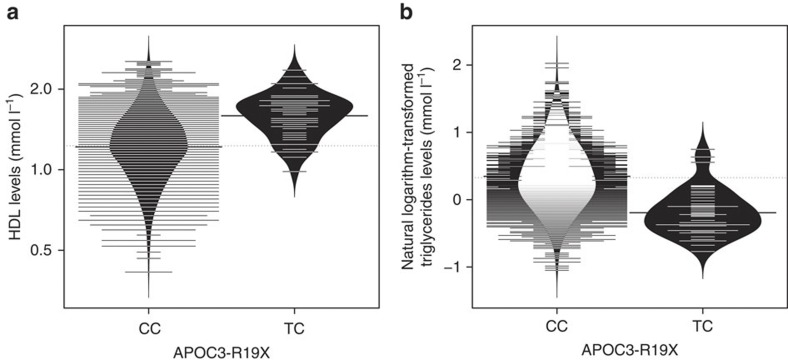
Figure 2. Bean plot of HDL and triglycerides by APOC3 R19X genotype.
The y-axis shows the untransformed HDL (a) levels (mmol l−1) and the natural logarithm-transformed triglycerides (b) levels (mmol l−1), respectively. HDL P=4.65 × 10⁻⁹ and triglycerides P=1.10 × 10⁻¹¹. P-values are generated from the likelihood ratio test, as calculated by GEMMA software.

