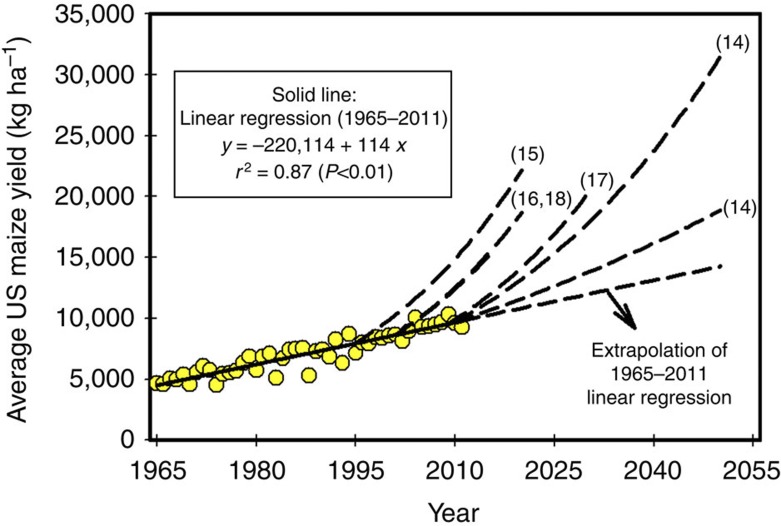
Figure 2. Historical trend in average US maize yield and reported projected trajectories based on compound rates of yield gain.
Historical trend (1965–2011, n=47 years of yield data) is indicated with the solid line and yellow data points, and associated linear-regression equation, coefficient of determination (r2) and Student’s t-test P-value are shown. Trajectories reported in publications that evaluated future food production potential based on these projected yield trajectories are indicated with the dashed lines. Numbers associated with each trajectory indicate the reference in which this exponential rate was used. The trajectory based on extrapolation of the 1965–2011 linear regression is also shown.

