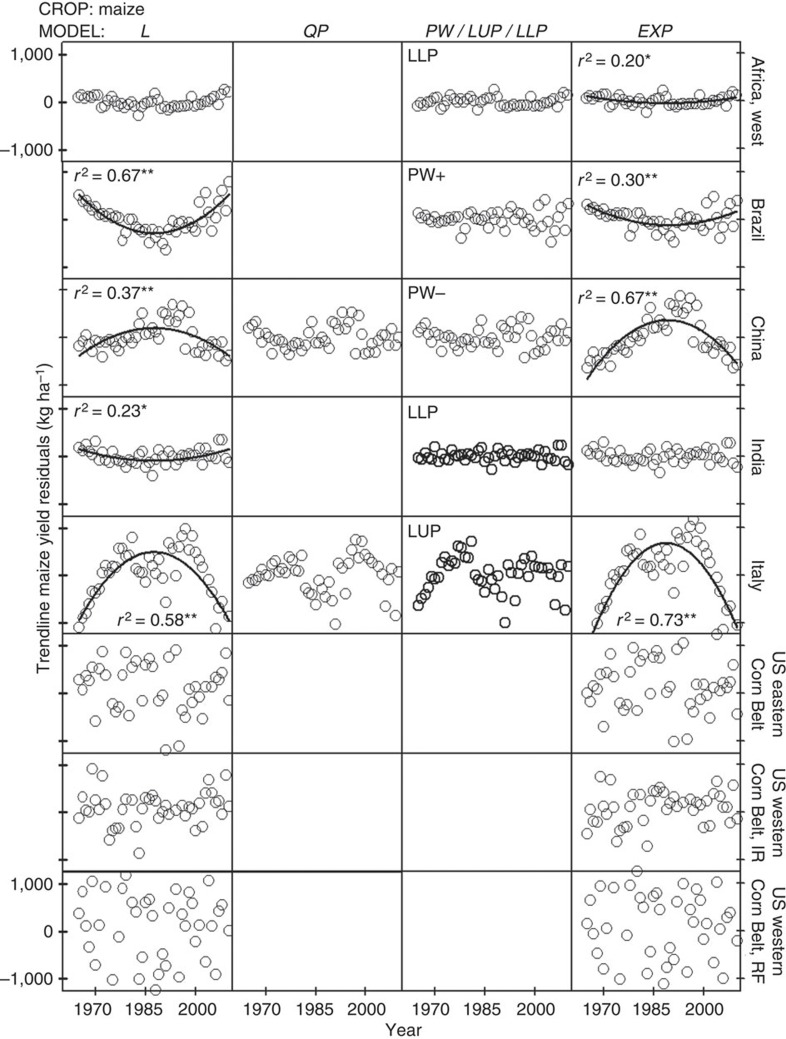
Figure 8. Trendline residuals for maize yield plotted against year for selected regions.
Selected regions are indicated in the right axis labels. Only one residual plot is shown for either the piecewise (PW+, PW−) or linear plateau with upper/lower plateau (LUP/LLP) because these models are mutually exclusive. The y axis scale is the same across all panels and is shown only in the upper and bottom panels. Asterisks indicate significance at F-test *P<0.01 or **P<0.001 of the fitted regression line to the residuals over time (n=46 years of yield data, except for USA (n=47)). L, linear; QP, quadratic plateau; PW, piecewise with (+) increasing or (−) decreasing rate after breakpoint year; LUP/LLP, linear with upper/lower plateau; EXP, compound exponential; R, rainfed; I, irrigated.

