Abstract
Schizophrenia and bipolar disorder are major psychiatric disorders with high heritability and overlapping genetic variance. Here we perform a genome-wide association study in an ethnically homogeneous cohort of 904 schizophrenia cases and 1,640 controls drawn from the Ashkenazi Jewish population. We identify a novel genome-wide significant risk locus at chromosome 4q26, demonstrating the potential advantages of this founder population for gene discovery. The top single-nucleotide polymorphism (SNP; rs11098403) demonstrates consistent effects across 11 replication and extension cohorts, totalling 23, 191 samples across multiple ethnicities, regardless of diagnosis (schizophrenia or bipolar disorder), resulting in Pmeta=9.49 × 10⁻¹² (odds ratio (OR)=1.13, 95% confidence interval (CI): 1.08–1.17) across both disorders and Pmeta=2.67 × 10⁻⁸ (OR=1.15, 95% CI: 1.08–1.21) for schizophrenia alone. In addition, this intergenic SNP significantly predicts postmortem cerebellar gene expression of NDST3, which encodes an enzyme critical to heparan sulphate metabolism. Heparan sulphate binding is critical to neurite outgrowth, axon formation and synaptic processes thought to be aberrant in these disorders.
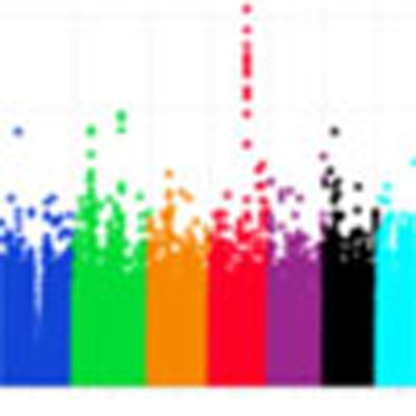 Schizophrenia and bipolar disorder are important psychiatric disorders with overlapping genetic components. Here, the authors identify and replicate a genome-wide significant risk locus for the two disorders, and suggest a role for NDST3 in severe psychiatric disease.
Schizophrenia and bipolar disorder are among the most severe psychiatric disorders. With a combined lifetime prevalence of 1–4% of the general population1, these disorders account for 4–5% of all disability in the developed world2 and are associated with high rates of mortality due to suicide, poor self-care and increased risk for cardiovascular disease and diabetes3. Family and twin studies have consistently reported high heritability (~0.80) for both disorders4, yet only a modest portion of the genetic variance of either disorder has been explained at the molecular level.
The historical distinction between schizophrenia and bipolar disorder, which was based on clinical observation studies of the late 19th century, has been challenged by recent genetic evidence. Notably, several alleles that have emerged from genome-wide association studies (GWAS) of one disorder have demonstrated significant association to the other disorder5. Moreover, a putative set of polygenic risk factors including thousands of common alleles of small effect can simultaneously predict risk for both schizophrenia and bipolar disorder, but not non-psychiatric disease (or even certain other psychiatric disorders)6,7. These molecular data are further supported by population-scale epidemiological studies, which have identified increased sibling recurrence of schizophrenia amongst first-degree relatives of bipolar probands, and vice versa8. These data suggest that combining cohorts of schizophrenia and bipolar disorder in molecular genetic studies may have dual advantages in enhancing power by increasing eligible sample size, and identifying the most fundamental risk factors in the aetiology of severe psychiatric disorder.
Prior GWAS in both schizophrenia and bipolar disorder have indicated that many common alleles of small effect remain to be detected9, but may require very large discovery cohorts (~10,000 subjects) in order to identify single-nucleotide polymorphisms (SNPs) attaining clear evidence of genome-wide significance10,11. However, it has been suggested that founder populations may possess enhanced power to detect effects of certain common alleles influencing complex disease, as a result of reduced allelic and locus heterogeneity12. Moreover, GWAS conducted in homogeneous populations can minimize statistical artifacts due to population stratification13. At the same time, common risk alleles identified in GWAS studies have generally been demonstrated to influence disease susceptibility across multiple ethnicities14, supporting the use of cosmopolitan replication cohorts.
Here we perform a GWAS in an ethnically homogeneous cohort of cases with schizophrenia and controls drawn from the Ashkenazi Jewish population. We replicate our top, genome-wide significant risk SNP (rs11098403) in 11 independent case–control cohorts of severe psychiatric disorder (comprising 5,415 schizophrenia cases, 4,785 bipolar cases and 12,991 controls) drawn from multiple populations. We then examine the functionality of rs11098403 by testing the effect of this variant on gene expression in postmortem brain tissue, and by performing supplementary in vitro and in silico experiments, thereby implicating a neighbouring gene, NDST3. These results suggest that abnormalities in heparan sulphate (HS) metabolism in the brain may underlie both schizophrenia and bipolar disorder.
Results
Genome-wide association analysis
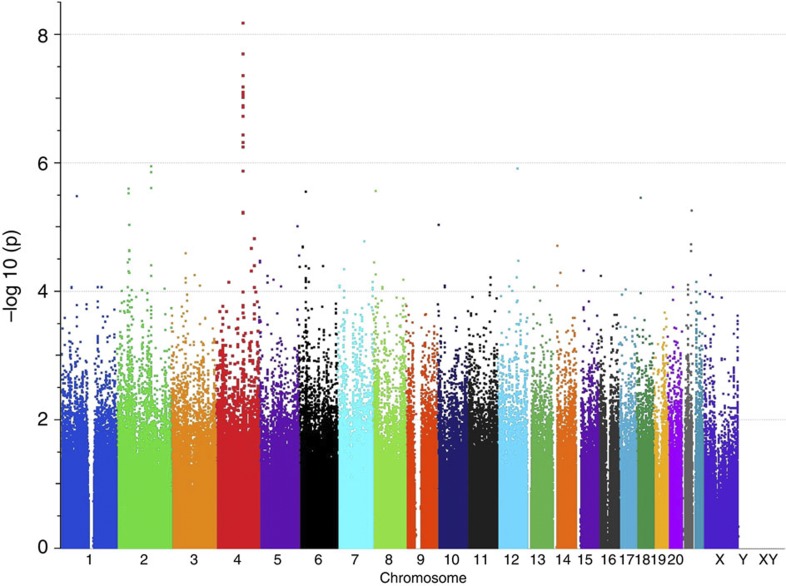
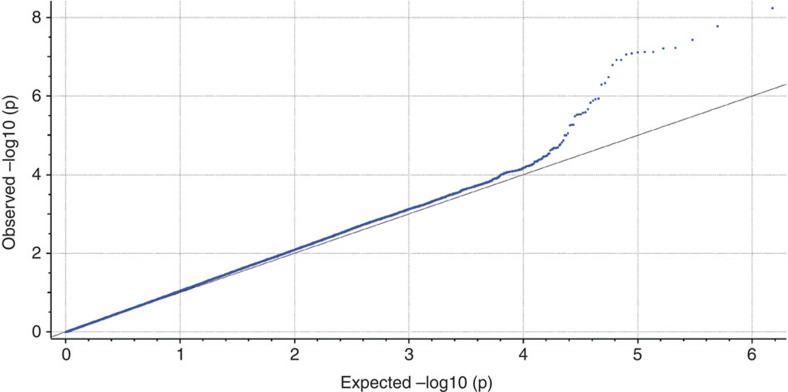
Using Illumina HumanOmni1-Quad arrays, we genotyped an ethnically homogeneous cohort of Ashkenazi Jewish (AJ) patients with schizophrenia and matching controls (Methods). After quality control, the final data set comprised 904 cases and 1,640 controls genotyped on 762,372 high-quality SNPs with 99.8% overall call rate (Supplementary Figs S1,S2). Logistic regression (additive model) yielded a single genome-wide significant signal at chromosome 4q26. This peak included the sixteen most strongly associated SNPs in the genome, all with P<10−6 (Fig. 1, Supplementary Data S1). A total of five SNPs fell below the study genome-wide significance threshold of P<6.56 × 10⁻⁸, with the most strongly associated SNP, rs11098403, obtaining Pgwas=6.55 × 10⁻⁹ (odds ratio (OR) for minor (G) allele=1.41, 95% confidence interval=1.26–1.59, Hardy–Weinberg Equilibrium for control P=0.23, case P=0.76 and overall P=0.14). For this analysis, λGC=1.038, which is considered ‘benign’13 (see Q–Q plot in Fig. 2); results also remained genome-wide significant (P=4.52 × 10⁻⁸; λGC=1.002) when examined with EMMAX, which controls for effects of residual population stratification and subtle cryptic relatedness.
Figure 1. Manhattan plot demonstrating genome-wide association results.
Logistic regression (additive model) was used to test the association between genetic variants and schizophrenia in the Ashkenazi Jewish discovery cohort.
Figure 2. Q–Q plot of the genome-wide association results.
Logistic regression (additive model) was used to test the association between genetic variants and schizophrenia in the Ashkenazi Jewish discovery cohort.
A list of all SNPs achieving nominal P-values<10−4 is provided in Supplementary Data S1. Notably, seven SNPs on this list are located in the MHC, which has been consistently associated with schizophrenia susceptibility in large-scale GWAS6,10. Supplementary Data S2 displays a systematic evaluation of effects in our discovery cohort for SNPs achieving genome-wide significance in prior large-scale (N>10,000 in discovery+replication cohorts) GWAS studies for schizophrenia or bipolar disorder (obtained from the NHGRI GWAS catalogue ( http://www.genome.gov/gwastudies/, downloaded 10 January 2013). For formal testing, we compared direction of effects at 23 loci (excluding the MHC) for which direct or proxy SNPs were available in our data set; each independent locus is represented only once in this analysis to avoid redundancy due to linkage disequilibrium (LD). We obtained the same direction of effects in our cohort at 21 loci (sign test P=3.3 × 10⁻⁵, one-tailed), including all available SNPs reported by the Psychiatric GWAS Consortium mega-analysis of schizophrenia10. Moreover, four loci were nominally significant in our data set, including SNPs in the extended MHC as well as NT5C2, PTGFR and CACNA1C.
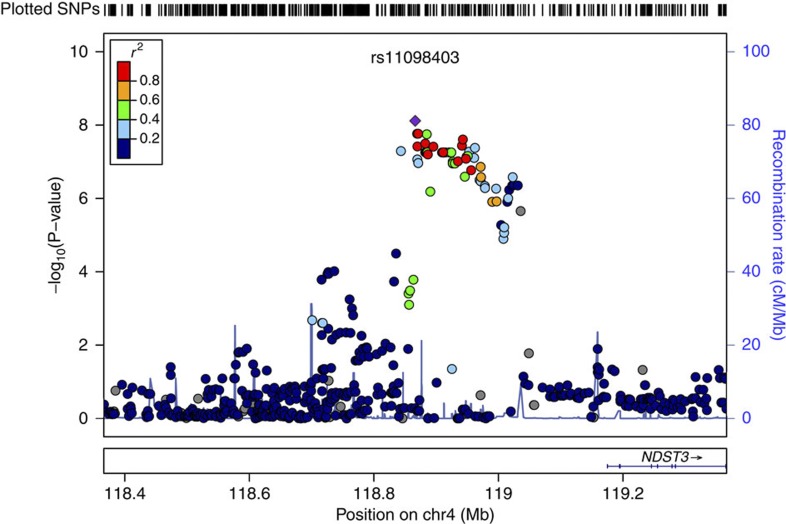
Due to the lack of a HapMap reference panel specific to the Ashkenazi population, primary analyses were conducted on genotyped SNPs only. However, genome-wide imputation using more densely genotyped HapMap3 data did not substantively alter results; no imputed SNPs attained stronger association P-values than that reported for our top genotyped SNP, rs11098403. In both genotyped and imputed data, nominally associated SNPs were observed across a ~300-kb span on chromosome 4 (~118.7–119.0 MB in Build 36/hg18 coordinates; Fig. 3). This locus is within an intergenic region in the vicinity of NDST3; the 5′-end of this gene is ~308 kb from rs11098403. Conditional analysis revealed no significant associations (all P>0.01) within a 1-MB region after controlling for effects of rs11098403 (Supplementary Fig. S3).
Figure 3. Regional association plot of the 4q26 region in the discovery cohort after HapMap3 imputation.
Note that no imputed SNP has a lower P-value (based on logistic regression under the additive model) than rs11098403.
Replication and meta-analysis
The top SNP in our Ashkenazi discovery cohort, rs11098403, was evaluated in 11 independent schizophrenia or bipolar disorder case–control cohorts of varying ethnicities, containing an additional 10,200 cases and 12,991 controls. Moreover, we sought replication in cosmopolitan samples, including those of African and Asian continental ancestry, in order to determine whether the signal observed in the discovery cohort was unique to the Ashkenazi population, or was merely stronger in Ashkenazi population but replicable in all populations.
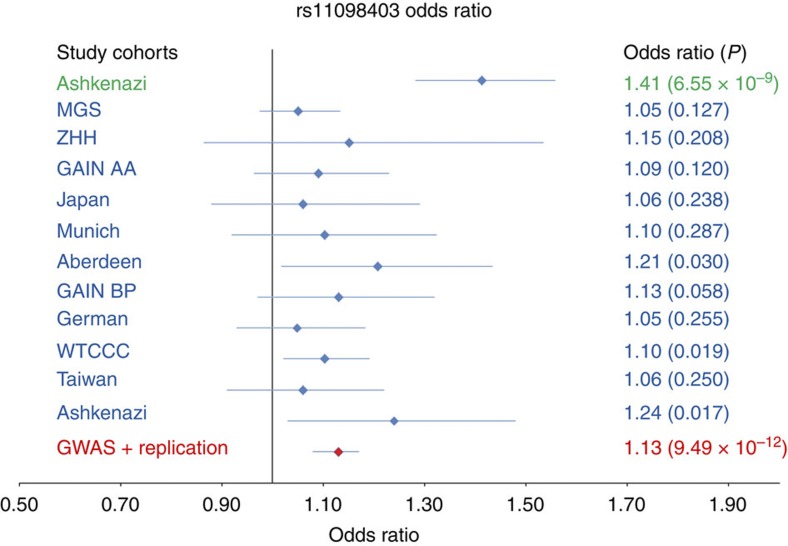
Results of the initial GWAS were supported in these independent cohorts (Table 1 and Fig. 4; note that P-values (additive model) are two-sided for the discovery cohort and for the combined analyses, while 1-sided P-values are listed for the replication cohorts). Meta-analysis for rs11098403 across all cohorts (using the weighted Z-score method as implemented in METAL15) resulted in a genome-wide significant Pmeta=2.67 × 10⁻⁸ (OR=1.15, 95% confidence interval (CI): 1.08–1.21) when considering the schizophrenia cohorts alone, and Pmeta=9.49 × 10⁻¹² (OR=1.13; 95% CI: 1.08–1.17) when all cohorts were included. Moreover, genome-wide significance was maintained when non-Caucasian cohorts were excluded (Pmeta=8.62 × 10⁻¹¹). Considering the non-discovery cohorts alone, significant independent evidence was obtained for association of rs11098403 to both schizophrenia (Prep=9.74 × 10⁻⁴) and bipolar disorder (Prep=5.40 × 10⁻⁵). All additional cohorts demonstrated effects in the same direction as the original discovery sample (sign test P=4.88 × 10⁻⁴), yielding a strongly significant overall replication (Prep=1.46 × 10⁻⁷; OR=1.09; 95% CI: 1.04–1.14), with three cohorts independently demonstrating nominal significance. Statistical tests of heterogeneity between all non-discovery cohorts, irrespective of ethnicity or diagnosis, were essentially null (Q=3.16, P=0.977, I2=0.00%); to further test for cohort heterogeneity, we repeated the meta-analysis removing one of the independent cohorts each time. Across these 11 analyses, Pmeta-values do not show much difference from the overall result, with a range of 8.10 × 10⁻¹² (when the MGS schizophrenia cohort was excluded) to 1.71 × 10⁻¹⁰ (when excluding the Ashkenazi bipolar cohort).
Table 1. Summary of logistic regression results for rs11098403 across cohorts.
| Sample | Ethnicity | Case diagnosis | Total samples | Controls | Cases | MAF controls | MAF cases | Odds ratio | Additive P-value | Reference (see supplement) |
|---|---|---|---|---|---|---|---|---|---|---|
| Discovery | ||||||||||
| Ashkenazi* | Caucasian | Schizophrenia | 2,544 | 1,640 | 904 | 0.38 | 0.47 | 1.41 | 6.55E−09 | |
| Replication/extension | ||||||||||
| MGS EA | Caucasian | Schizophrenia | 4,942 | 2,056 | 2,886 | 0.27 | 0.28 | 1.05 | 0.127 | 49 |
| ZHH | Caucasian | Schizophrenia | 317 | 140 | 177 | 0.29 | 0.32 | 1.15 | 0.208 | 50 |
| MGS AA* | African–American | Schizophrenia | 1,875 | 954 | 921 | 0.25 | 0.27 | 1.09 | 0.12 | 49 |
| Japan* | Asian | Schizophrenia | 1,080 | 530 | 550 | 0.16 | 0.17 | 1.06 | 0.238 | 51 |
| Munich | Caucasian | Schizophrenia | 842 | 412 | 430 | NA | NA | 1.1 | 0.287 | 52 |
| Aberdeen | Caucasian | Schizophrenia | 892 | 441 | 451 | NA | NA | 1.21 | 0.03 | 52 |
| GAIN | Caucasian | Bipolar | 1,710 | 689 | 1,021 | 0.25 | 0.28 | 1.13 | 0.058 | 53 |
| German | Caucasian | Bipolar | 1,982 | 1,300 | 682 | 0.29 | 0.31 | 1.05 | 0.255 | 54 |
| WTCCC | Caucasian | Bipolar | 4,806 | 2,938 | 1,868 | 0.25 | 0.27 | 1.1 | 0.019 | 55 |
| Taiwan* | Asian | Bipolar | 2,000 | 1,000 | 1,000 | 0.15 | 0.16 | 1.06 | 0.25 | 56 |
| Ashkenazi* | Caucasian | Bipolar | 2,745 | 2,531 | 214 | 0.38 | 0.43 | 1.24 | 0.0177 | |
| All cohorts excluding discovery | 23,191 | 12,991 | 10,200 | 1.09 | 1.46E−07 | |||||
| All cohorts | 25,735 | 14,631 | 11,104 | 1.13 | 9.49E−12 | |||||
AA, African–American; EA, European–American; GAIN, The Genetic-Association Information Network; MAF, minor allele frequency; MGS, molecular genetics of schizophrenia; WTCCC, The Wellcome Trust Case–Control Consortium; ZHH, The Zucker Hillside Hospital.
P-values are two-sided for the discovery cohort and combined analyses; one-sided P-values are listed for the replication cohorts.
Cohort details are available in Supplementary Note 1.
Figure 4. Odds ratio plot showing allelic effects of the G allele of rs11098403 in the discovery and 10 independent cohorts of schizophrenia or bipolar disorder cases and controls.
P-values were generated using logistic regression under the additive model and are presented in parentheses. Error bars represent the 95% confidence interval of the odds ratios.
Potential regulatory role of rs11098403 on NDST3
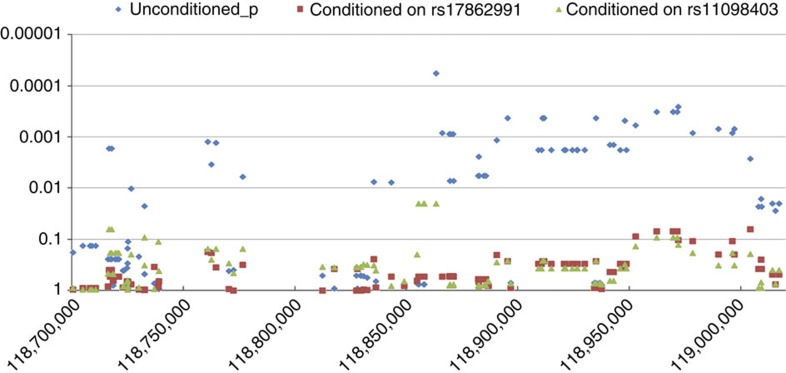
As rs11098403 does not fall within the same LD block as NDST3 (or any other gene) in any population, we obtained several lines of evidence supporting a regulatory relationship between this SNP and NDST3. Most notably, data derived from postmortem cerebellar tissue (total n=119, comprised of 39 patients with schizophrenia, 36 with bipolar disorder and 44 healthy controls) demonstrated a significant relationship between risk allele carrier status at rs11098403 and SVA-corrected expression of NDST3 using logistic regression under the additive model (P=8.4 × 10⁻⁴, Fig. 5); carriers of the risk allele had significantly higher expression compared with homozygotes for the common allele. In addition, all SNPs within the LD block containing rs11098403 (hg18; Chr4: 118.7–119.0 MB) demonstrate nominally significant association to NDST3 expression levels (all P<0.01 using logistic regression, additive model), and conditional analysis indicates no secondary sources of signal within the region (Fig. 5). Although the strongest statistical signal was observed at a neighbouring SNP (rs17862991, which is 2,801 bp from rs11098403), the precise functional element is not recoverable from this analysis due to the effects of LD.
Figure 5. Expression of NDST3 in postmortem cerebellar tissue as a function of genotype.
Associations within the LD block containing rs11098403 were tested using logistic regression under the additive model. Three plots are presented on the same scale for these eQTL analyses. The raw (unconditioned) P-values are shown in blue, the P-values conditioned on rs11098403 (hg18 coordinates) are shown in green and the P-values separately conditioned on rs17862991 are shown in red.
By contrast, no significant relationship was observed between rs11098403 and any of the eight other transcripts available on our expression arrays within a 3-MB window centred on this SNP (all additive model logistic regression analyses P>0.3). The eQTL effect at NDST3 remained significant when the control group (n=44) alone was examined (P=0.002), indicating that the association of genotype to expression is not an artifact of psychiatric status or medication. Moreover, using analysis of covariance, there were no significant main effects of diagnostic group (P=0.801) and no interaction of diagnostic group and genotype (P=0.902; Supplementary Fig. S4).
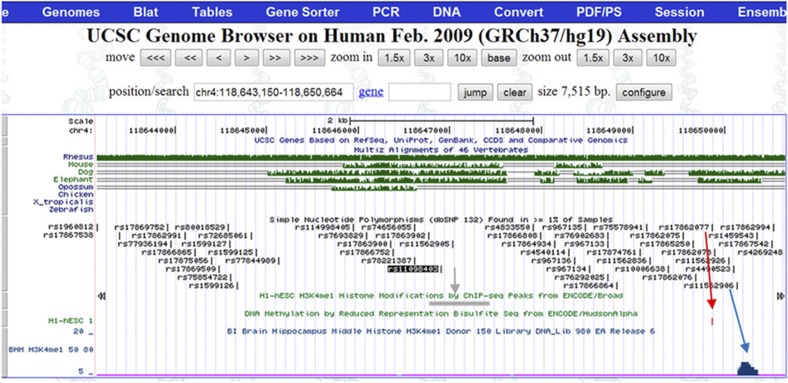
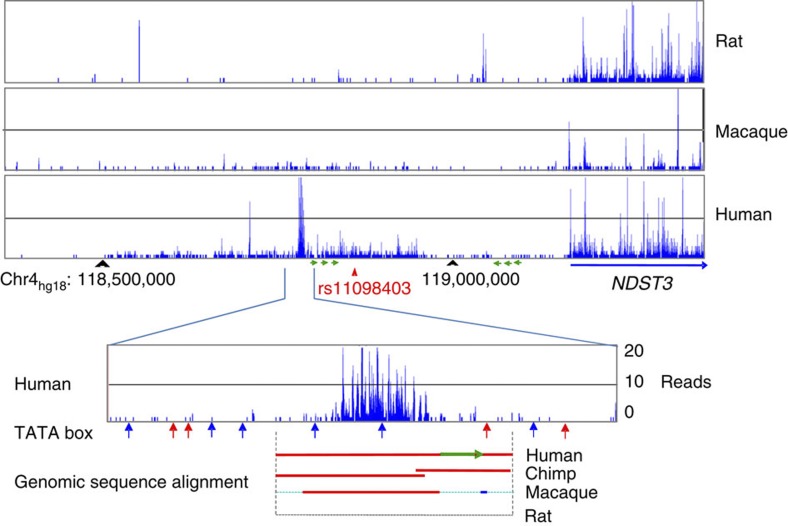
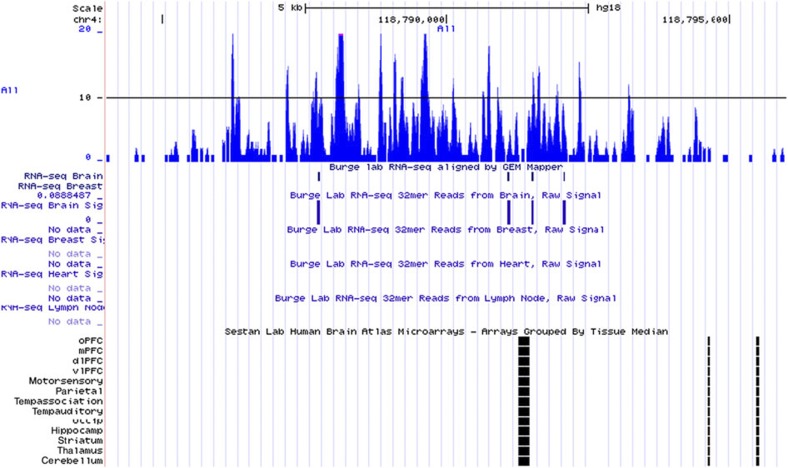
Next, we performed an in silico analysis of the LD block surrounding rs11098403. As depicted in Fig. 6, rs11098403 occurs in a conserved region that overlaps ENCODE enhancer sites (H3K4Me1, grey and blue arrows in Fig. 6). Moreover, a close proxy SNP rs17862077 (2,953 bp telomeric to rs11098403; r2=0.96 in 1,000 Genomes CEU), neighbours an unmethylated CpG island (red arrow), which is uncommon within the intergenic window (Supplementary Fig. S5). Finally, RNA-seq performed in postmortem hippocampal tissue (n=31 human, 20 macaque and 16 rat samples) identified a novel, non-coding transcript adjacent to rs11098403 consistently expressed in each individual human sample (Fig. 7 displays signal pooled across all samples; Fig. 8 compares our results to publicly available UCSC expression tracks). Although too weakly expressed in each individual to perform eQTL analysis, it is notable that this transcript shows considerable sequence homology (1,034 nucleotides spanning a 3-kb region) with a splice variant of NDST3 that is annotated by Ensembl as a retained intron (ENST00000394488; Fig. 9); retained introns are known to affect relative expression of primary and alternative transcripts of genes16.
Figure 6. In silico analysis of region immediately surrounding top GWAS SNP rs11098403.
An H3K4me1 activation mark at this locus is observed in H1 human embryonic cell lines (grey arrow). A close proxy SNP (rs17862077, which is 2,953 bp telomeric to rs11098403; r2=0.96 in 1,000 Genomes CEU), neighbours an unmethylated CpG island (red arrow), which is the only such site within an 850-kb intergenic window. Additional SNPs with the same LD relationship to rs11098403 (for example, rs11562906) localize to an H3K4me1 mark detected in hippocampus (blue arrow).
Figure 7. RNA-seq expression profile in hippocampus of rat, macaque and human.
Genomic features in the syntenic region of 1 Mb around human rs11098403 are represented. TATA boxes were predicted by TSSG (Softberry Inc) and the predicted TATA box locations were depicted with vertical arrows (red on plus strand and blue on minus strand of chromosome 4). In cross-species genomic sequence alignment, high sequence similarity was depicted in red (same orientation) and blue (opposite orientation); low sequence similarity was depicted in cyan. Green arrowed lines represent the location and orientation of the repeat sequences around rs11098403; the green horizontal arrow in the bottom panel corresponds to the left-most green arrow in the panel above.
Figure 8. Comparison of novel hippocampal transcript expression detected by RNA-seq.
Expression data were observed in publicly available UCSC browser tracks. There is some overlap with small transcripts observed in prior studies of brain, but not other tissues.
Figure 9. BLAT alignment of DNA sequences underlying the novel transcript.
The novel transcript (observed in Fig. 7) sequence demonstrates considerable homology (red) to an included intron variant (light blue) of NDST3.
Discussion
NDST3 encodes N-deacetylase/N-sulfotransferase (heparan glucosaminyl) 3, an enzyme found in the Golgi apparatus, which helps define the binding properties of HS17. NDST3 is expressed in both fetal and adult brain, with highest abundance in hippocampus and cerebellum18. Knockout of this gene in mice results in substantially reduced sulfation of HS in cortex, but paradoxically increased N-, 6-O-, and 2-O-sulfation in the cerebellum, possibly due to compensatory activity of other sulfotransferase enzymes19. HS subtypes have diverse cellular functions, acting as co-receptors for multiple growth factor molecules20. Thus, aberrant sulfation of HS could have a role in several critical neurodevelopmental processes, including neurite outgrowth21, axon guidance22 and synapse formation23. Differentially sulfated HS proteoglycans have varying patterns of binding to neuregulin-1 (NRG1), thereby altering NRG1 distribution and signalling of erbB4 in the nervous system24; converging lines of evidence have implicated NRG1/erbB4 signalling abnormalities in both schizophrenia and bipolar disorder25.
Although most GWAS studies are conducted in outbred populations of European ancestry, examination of alternate populations has been a successful strategy for identification of novel risk alleles26,27. Our use of a founder population may have resulted in a stronger result than typically observed in GWAS discovery cohorts in psychiatry. Although statistical significance was enhanced, in part, by the greater minor allele frequency observed for rs11098403 in the general AJ population compared with all other populations, our data also suggest an enhanced penetrance of the risk allele in AJ populations, with a relatively large discovery OR. As GWAS effects are generally over-estimated in discovery cohorts (the so-called ‘winner’s curse’), we applied a bias correction method28 to the discovery effect size estimate. The corrected OR estimate obtained using the two-stage method was 1.34 (95% CI: 1.20–1.45), and the weighted mean square error (MSE) estimator that takes into account overcorrection was 1.37 (95% CI: 1.26–1.48). Notably, the Ashkenazi replication cohort also provided a larger effect size than all non-AJ replication cohorts.
Heightened effect sizes for specific GWAS loci have been reported in Ashkenazi cohorts in at least two other complex diseases: rs2180341 (RNF146) in breast cancer29 and rs2076756 (NOD2) in Crohn’s30. This phenomenon may be related to the unique demographic history of the Ashkenazim, which was marked by an extreme bottleneck followed by exceptionally rapid expansion31,32. Such a history can result in blocks of enhanced LD relative to outbred populations, and enhanced LD can increase the effectiveness of GWAS for tagging a causal variant33. In our data, there are ~50% more SNP pairs with moderate or stronger LD within 500 kb of rs11098403 in AJ (191 SNP pairs with r2≥0.5) compared to CEU samples (only 123 such pairs). Moreover, the average LD of these SNP pairs is significantly greater in the AJ cohort (paired t-test=4.991; P=1 × 10⁻⁶; Supplementary Fig. S6). In addition, AJ are relatively more homogeneous than the general Caucasian population34, with decreased background genetic variation35. Enhanced GWAS effect sizes have been reported in other homogeneous and/or isolated populations36,37.
Consistency of results across both schizophrenia and bipolar disorder support a growing body of evidence that current diagnostic boundaries in psychiatric nosology are not biologically valid5,8. Although modifier genes influencing specific clinical features of the phenotype may be identified by future research, NDST3 variation appears to predispose to severe psychiatric disease of varying presentations.
Methods
Discovery cohort description
Case (n=1,156) and control (n=2,279) samples were selected from an Ashkenazi Jewish repository (Hebrew University Genetic Resource, HUGR, http://hugr.huji.ac.il). Patients for discovery analysis were recruited from hospitalized inpatients at seven medical centres in Israel. All diagnoses were assigned after direct interview using the structured clinical interview (SCID)38, a questionnaire with inclusion and exclusion criteria, and cross-references to medical records. The inclusion criteria specified that subjects had to be diagnosed with schizophrenia or schizoaffective disorder by the Diagnostic and Statistical Manual of Mental Disorders (DSM-IV), that all four grandparents of each subject were reported by the subject to be of Ashkenazi Jewish ethnic origin, and that each subject or the subject’s legal representative has signed the informed-consent form. The exclusion criteria eliminated subjects diagnosed with at least one of the following disorders: psychotic disorder due to a general medical condition, substance-induced psychotic disorder, or any Cluster A (schizotypal, schizoid or paranoid) personality disorder. Samples from healthy Ashkenazi individuals were collected from volunteers at the Israeli Blood Bank; these subjects were not psychiatrically screened but reported no chronic disease and were taking no medication at the time of blood draw. Corresponding institutional review boards and the National Genetic Committee of the Israeli Ministry of Health approved the studies. All samples were fully anonymized immediately after collection and subsequently, genomic DNA was extracted from blood samples through use of the Nucleon kit (Pharmacia). Genotyping and analyses were performed under protocols approved by the Institutional Review Board of the North Shore-LIJ Health System.
Genotyping and quality control
Genotyping was performed for~1 million genome-wide SNPs using Illumina HumanOmni1-Quad arrays according to manufacturers’ specifications. As depicted in Supplementary Fig. S1, SNPs were filtered on the following bases: call rate <98%, minor allele frequency <0.02 and Hardy–Weinberg exact test P<0.000001 in controls. Samples were filtered based on genotype quality control filtration (sample call rate <97%, gender mismatch) and examined for cryptic identity and first- or second-degree relatedness using pairwise identity-by-decent estimation (PI_HAT) in PLINK39 with 128,403 LD pruned (r2 >0.2) genome-wide SNPs. Samples were excluded based on PI_Hat>0.125; the individual with lower call rate from each control/control or case/case pair was excluded, and controls were excluded from case/control pairs.
These remaining samples were further examined for underlying population stratification using principal component analysis (PCA) with ancestry informative markers specific for the Ashkenazi Jewish population35. Samples with PCA results suggestive of one or more non-AJ grandparents were identified as outliers based on first principal component score >0.01 and were excluded from further analysis (n=607).
Statistical analysis
The allelic association between each SNP and the risk of schizophrenia was assessed using logistic regression under the additive model, covarying for the first two components derived from genome-wide principal components analysis; only the first two PCs carried eigen values >1 (Supplementary Fig. S2). These analyses were implemented in SVS7 software (Golden Helix, Inc., Bozeman, MT). The threshold for genome-wide significance was established at P<6.56 × 10⁻⁸ based upon a strict Bonferroni correction for 762,372 tests at α=0.05, which may be considered conservative given that tests of linked SNPs are not independent40. EMMAX41 analysis was conducted using correction for identity-by-state, as well as the same 2 principal components as covariates. Conditional analysis controlling for the effects of the top SNP in the region were conducted in PLINK.
Imputation analysis
We performed imputation analysis to determine the full extent of the associated region, and to test for any untyped variants with stronger associations than those available on the original Illumina GWAS platform. After pre-phasing of the original data using SHAPEIT42, genome-wide imputation was performed using IMPUTE243 using the cosmopolitan HapMap3 reference panel (n=1,011 individuals from Africa, Asia, Europe and the Americas). Association tests (additive model, using the same two PCA covariates described above) were performed on imputed genotype dosages using the SNPTEST program within the IMPUTE2 framework on a total of 1,622,655 SNPs; of these, 70,330 SNPs were monomorphic and were not examined further.
Replication cohorts and meta-analysis
We examined the association of the top SNP from our schizophrenia discovery cohort in six independent non-Ashkenazi schizophrenia case–control cohorts and four non-Ashkenazi bipolar case–control cohorts, as well as one Ashkenazi bipolar case–control cohort, encompassing 23,191 individuals, as described in Table 1 and in Supplementary Note 1. Each of the non-Ashkenazi replication cohorts were drawn from published, peer-reviewed studies and all subjects provided written, informed consent in studies conducted in accordance with the Declaration of Helsinki and approved by local ethics committees. The top associated SNP from the discovery cohort was directly genotyped (not imputed) in nine replication cohorts using the following platforms; Affymetrix 6.0, Affymetrix 500 k and Illumina Hap550. For two cohorts (Munich and Aberdeen), the top discovery SNP was not available, so the nearest SNP (rs1870482, r2=0.95 in HapMap2 CEU population) was used as proxy. All analyses were performed under the additive model.
Meta-analysis across cohorts was performed based on the weighted Z-score method using METAL15. As described in previous GWAS meta-analysis10,44,45, P-values for each replication cohort are reported as one-tailed tests, while P-values for all combined analysis are reported as two-tailed tests. Before meta-analysis in METAL, P-values for each replication cohort were converted to z-scores as described by Nyholt et al.45 Between-group heterogeneity was accessed by Cochran’s Q statistics and I2. It should be emphasized that no replication cohorts were examined and subsequently excluded for any reason. No further replication cohorts, beyond the eleven reported, were sought due to the relative stability of the parameter estimate: given that our combined total of 25,735 subjects yielded a P-value approximately three orders of magnitude beyond the conventional threshold of statistical significance, a further doubling of the total sample size would reduce the 95% confidence interval of the OR by a mere 0.01 units on each end.
Winners curse analysis
In order to adjust for potential selection bias, commonly referred to as the winner’s curse, we utilized a conditional maximum likelihood approach28, in which a corrected OR estimate is derived using the asymptotic approximation to the conditional probability density function of the log OR estimate after selection. This OR estimate is then subjected to a weighted MSE estimator, to account for potential overcorrection of the corrected estimate. To isolate effects of the winner’s curse from population-specific effects that may differentiate AJ cohorts, we considered the AJ discovery cohort as the first stage and the AJ replication cohort as the second stage in a two-stage design. The weighted MSE estimator was obtained as a linear combination of OR estimates from the AJ discovery cohort and the corrected OR estimate. All calculations were done using R codes obtained from the authors of the method28.
LD analysis
Randomly-selected Ashkenazi controls (n=60) and 60 CEU HapMap founder samples were used to compare the LD structure in the 500 kb region surrounding rs11098403. For purposes of comparison, only SNPs directly genotyped in both samples were examined.
Genotype-expression correlation analysis
To determine the functional effect of our disease-associated SNP, we performed a gene expression study in a set of postmortem brain samples obtained from the Stanley Medical Research Institute (SMRI). Cerebellar tissue was obtained from 119 Caucasian subjects, including patients diagnosed with schizophrenia (n=39), bipolar disorder (n=36) and donors without psychiatric disease (n=44). Diagnoses of the samples were made by two senior psychiatrists, using the DSM-IV criteria and based on medical records, and, when possible, telephone interviews with family members. Diagnoses of unaffected controls were based on structured interviews by a senior psychiatrist with family member(s) to rule out Axis-I diagnoses. All samples have age, gender, postmortem interval (PMI), brain pH, smoking and alcohol use, suicide status and antipsychotic medication data.
Genomic DNA was extracted from frozen cerebellar tissues provided by the SMRI. A phenol/chloroform/isoamyl alcohol protocol was modified and followed. The DNA was resuspended in 0.1 mM EDTA TE buffer. Genomic DNA was evaluated by NanoDrop ND-1000 spectrophotometer (NanoDrop Technologies, Wilmington, DE) for concentration and by 1% agarose gel to validate the DNA integrity. Genotyping was performed using Affymetrix GeneChip Mapping 5.0 Array and Assay Kits (Affymetrix, Santa Clara, CA) according to the Affymetrix protocol46. Genotypes were called with the BRLMM-p algorithm (Affymetrix) with all arrays simultaneously. SNP call rates ranged from 97.3–99.58% (average 98.9%).
Total RNA was extracted from frozen cerebellar tissues using miRNeasy mini kit (Qiagen, Valencia, CA). Gene expression was assessed using the Affymetrix GeneChip Human Gene 1.0 ST array according to manufacturer’s protocols. The experiments were performed at NIH Neuroscience Microarray Consortium at Yale University. The raw CEL gene expression files were processed by Affymetrix Expression Console software EC1.1.2 using customized SNP-free library files. Batch effects were removed by ComBat in R package47. For the genotype-expression correlation analysis, SVA48 was used to remove effects of all confounding covariates. For purposes of the present study, we considered the relationship of alleles from our top disease-associated SNP to expression of nine transcripts available on our expression arrays within a 3-MB window centred on rs11098403. Next, we performed eQTL analyses to examine the association between NDST3 and all available SNPs (n=40) within the region of our GWAS signal (hg18; Chr4:118.7–119.0 MB). For the analysis of differential expression across groups, analysis of covariance analysis including six factors (age, PMI, brain_pH, Affection status, sex and antipsychotics) was performed in SPSS16.0 software ( http://www.spss.com). For these analyses, heterozygotes were combined with the risk allele homozygotes; cell sizes were too small to permit modelling of additive allelic effects in each diagnostic group.
Genome-wide expression profiling using RNA-seq technology
Postmortem brain tissue (hippocampus) of 31 humans was obtained from the University of Miami Brain Endowment Bank (Miami, FL, USA). Postmortem hippocampus of 10 rhesus macaques was obtained from the National Institutes of Health Animal Center in Poolesville, Maryland. Hippocampal tissue from 16 rats was obtained from Dr Howard Edenberg’s lab at Indiana University. The human research protocol for procedures involved in collecting postmortem brain and associated data was approved by the University of Miami. Macaque study protocols were approved by the NIAAA and NICHD Animal Care and Use Committees. Rat study protocols were approved by the Institutional Animal Care and Use Committee at Indiana University School of Medicine.
Total RNA was extracted from ~100 mg of hippocampus tissue and mRNA was isolated from 35 μg of total RNA with Dynabeads oligo (dT)25 (Invitrogen). The purified mRNA was fragmented to the 150–500 bases by mixing with 10x fragmentation buffer (Ambion, Austin, TX) and heating at 70 °C for 3 min. Approximately 200 ng of fragmented mRNA was used for synthesize cDNA synthesis following Illumina’s mRNAseq protocol. RNA-seq was carried out for each sample individually on an Illumina Genome Analyser (Illumina, San Diego, CA) according to Illumina protocols with 36 cycles using the ‘sequencing-by-synthesis’ method. Sequences were called from image files with the Illumina Genome Analyser Pipeline (GApipeline) and aligned to the corresponding reference genomes (UCSC hg18 for human, UCSC rheMac2 for macaque, and UCSC rn4 for rat) using Extended Eland in the GApipeline. The uniquely mapped reads (total of 297.8 million for human, 44.6 million for macaque and 125.5 million for rat) were parsed with in-house Perl scripts to generate WIG files, which were used to view the expression profile with UCSC Genome Browser. All raw sequences generated in this study have been deposited in the Sequence Read Archive (NCBI) with the accession numbers SRA028822, SRA027316, SRA029279 and SRA029275.
Author contributions
T.L., S.G. and A.D. wrote the manuscript. A.D. coordinated sample recruitment and phenotype assessment. T.L., A.D., I.P., J.M.K., D.G. and A.K.M. conceptualized and designed the study. T.L. and S.G. performed the primary analyses and interpreted the genome-wide data. C.L., L.C., C.Z. and J.B. performed the expression experiments and analysis. J.R., M.J. and S.M. contributed statistical analyses. A.T.L. and P.K.G. oversaw the genotyping of the samples. M.I., N.I., S.C. M.R., M.M.N., A.T.A.C. and A.P. provided replication data. C.H., Q.Y. and P.D. contributed RNA-seq data. All the authors contributed to the current version of the paper.
Additional information
How to cite this article: Lencz, T. et al. Genome-wide association study implicates NDST3 in Schizophrenia and bipolar disorder. Nat. Commun. 4:2739 doi:10.1038/ncomms3739 (2013).
Supplementary Material
Supplementary Figures S1-S6, Supplementary Note 1 and Supplementary References
List of genome-wide SNPs achieving logistic regression (additive model) p-values > 10-4
Effects in the discovery cohort for SNPs achieving genome-wide significance in prior large-scale GWAS studies for schizophrenia or bipolar disorder.
Acknowledgments
We thank Michael Ryan of the Feinstein Institute Biorepository for assistance with sample handling and preparation. This work was supported by the North Shore-LIJ Health System Foundation and the National Institutes of Health (RC2 MH089964, R01 MH095458 and R01 MH084098 to T.L.; P50 MH080173 to A.K.M.; P30 MH090590 to J.M.K.; and R01 MH080425 to C.L.). We thank David B. Goldstein for providing summary data from the Aberdeen and Munich cohorts. We are extremely grateful to investigators, including Pablo Gejman, John Kelsoe and Nick Craddock, who have made their genotype data publicly available through dbGAP and the Wellcome Trust Case–Control Consortium (WTCCC). A full list of the investigators who contributed to the generation of these data sets is available from www.wtccc.org.uk as well as the following studies within dbGAP ( http://www.ncbi.nlm.nih.gov/projects/gap):
/cgi-bin/study.cgi?study_id=phs000167.v1.p1;
/cgi-bin/study.cgi?study_id=phs000021.v2.p1;
/cgi-bin/study.cgi?study_id=phs000017.v3.p1.
References
- Perälä J. et al. Lifetime prevalence of psychotic and bipolar I disorders in a general population. Arch. Gen. Psychiatry 64, 19–28 (2007). [DOI] [PubMed] [Google Scholar]
- Prince M. et al. No health without mental health. Lancet 370, 859–877 (2007). [DOI] [PubMed] [Google Scholar]
- Laursen T. M. et al. Increased mortality among patients admitted with major psychiatric disorders: a register-based study comparing mortality in unipolar depressive disorder, bipolar affective disorder, schizoaffective disorder, and schizophrenia. J. Clin. Psychiatry 68, 899–907 (2007). [DOI] [PubMed] [Google Scholar]
- Cardno A. G. et al. Heritability estimates for psychotic disorders: the Maudsley twin psychosis series. Arch. Gen. Psychiatry 56, 162–168 (1999). [DOI] [PubMed] [Google Scholar]
- Williams H. J. et al. Most genome-wide significant susceptibility loci for schizophrenia and bipolar disorder reported to date cross-traditional diagnostic boundaries. Hum. Mol. Genet. 20, 387–391 (2011). [DOI] [PubMed] [Google Scholar]
- The International Schizophrenia Consortium. Common polygenic variation contributes to risk of schizophrenia and bipolar disorder. Nature 460, 748–752 (2009). [DOI] [PMC free article] [PubMed] [Google Scholar]
- Cross-Disorder Group of the Psychiatric Genomics Consortium. Genetic relationship between five psychiatric disorders estimated from genome-wide SNPs. Nat. Genet. 45, 984–994 (2013). [DOI] [PMC free article] [PubMed] [Google Scholar]
- Van Snellenberg J. X. & de Candia T. Meta-analytic evidence for familial coaggregation of schizophrenia and bipolar disorder. Arch. Gen. Psychiatry 66, 748–755 (2009). [DOI] [PubMed] [Google Scholar]
- Lee S. H. et al. Estimating the proportion of variation in susceptibility to schizophrenia captured by common SNPs. Nat. Genet. 44, 247–250 (2012). [DOI] [PMC free article] [PubMed] [Google Scholar]
- The Schizophrenia Psychiatric Genome-Wide Association Study (GWAS) Consortium. Genome-wide association study identifies five novel schizophrenia loci. Nat. Genet. 43, 969–976 (2011). [DOI] [PMC free article] [PubMed] [Google Scholar]
- Psychiatric GWAS Consortium Bipolar Disorder Working Group. Large-scale genome-wide association analysis of bipolar disorder identifies a new susceptibility locus near ODZ4. Nat. Genet. 43, 977–983 (2011). [DOI] [PMC free article] [PubMed] [Google Scholar]
- Kristiansson K., Naukkarinen J. & Peltonen L. Isolated populations and complex disease gene identification. Genome Biol. 9, 109 (2008). [DOI] [PMC free article] [PubMed] [Google Scholar]
- Price A. L., Zaitlen N. A., Reich D. & Patterson N. New approaches to population stratification in genome-wide association studies. Nat. Rev. Genet. 11, 459–463 (2010). [DOI] [PMC free article] [PubMed] [Google Scholar]
- Gibson G. Rare and common variants: twenty arguments. Nat. Rev. Genet. 13, 135–145 (2012). [DOI] [PMC free article] [PubMed] [Google Scholar]
- Willer C. J., Li Y. & Abecasis G. R. METAL: fast and efficient meta-analysis of genomewide association scans. Bioinformatics 26, 2190–2191 (2010). [DOI] [PMC free article] [PubMed] [Google Scholar]
- Galante P. A., Sakabe N. J., Kirschbaum-Slager N. & de Souza S. J. Detection and evaluation of intron retention events in the human transcriptome. RNA 10, 757–765 (2004). [DOI] [PMC free article] [PubMed] [Google Scholar]
- Aikawa J. & Esko J. D. Molecular cloning and expression of a third member of the heparan sulfate/heparin GlcNAc N-deacetylase/N-sulfotransferase family. J. Biol. Chem. 274, 2690–2695 (1999). [DOI] [PubMed] [Google Scholar]
- Lein E. S. et al. Genome-wide atlas of gene expression in the adult mouse brain. Nature 445, 168–176 (2007). [DOI] [PubMed] [Google Scholar]
- Pallerla S. R. et al. Altered heparan sulfate structure in mice with deleted NDST3 gene function. J. Biol. Chem. 283, 16885–16894 (2008). [DOI] [PMC free article] [PubMed] [Google Scholar]
- Lander A. D. & Selleck S. B. The elusive functions of proteoglycans: in vivo veritas. J. Cell Biol. 148, 227–232 (2000). [DOI] [PMC free article] [PubMed] [Google Scholar]
- Irie F. et al. Heparan sulfate regulates ephrin-A3/EphA receptor signaling. Proc. Natl Acad. Sci. USA 105, 12307–12312 (2008). [DOI] [PMC free article] [PubMed] [Google Scholar]
- Inatani M., Irie F., Plump A. S., Tessier-Lavigne M. & Yamaguchi Y. Mammalian brain morphogenesis and midline axon guidance require heparan sulfate. Science 302, 1044–1046 (2003). [DOI] [PubMed] [Google Scholar]
- Lucido A. L. et al. Rapid assembly of functional presynaptic boutons triggered by adhesive contacts. J. Neurosci. 29, 12449–12466 (2009). [DOI] [PMC free article] [PubMed] [Google Scholar]
- Pankonin M. S., Gallagher J. T. & Loeb J. A. Specific structural features of heparan sulfate proteoglycans potentiate neuregulin-1 signaling. J. Biol. Chem. 280, 383–388 (2005). [DOI] [PubMed] [Google Scholar]
- Green E. K. et al. Operation of the schizophrenia susceptibility gene, neuregulin 1, across traditional diagnostic boundaries to increase risk for bipolar disorder. Arch. Gen. Psychiatry. 62, 642–648 (2005). [DOI] [PubMed] [Google Scholar]
- Shi Y. et al. Common variants on 8p12 and 1q24.2 confer risk of schizophrenia. Nat. Genet. 43, 1224–1227 (2011). [DOI] [PMC free article] [PubMed] [Google Scholar]
- Yue W. Genome-wide association study identifies a susceptibility locus for schizophrenia in Han Chinese at 11p11.2. Nat. Genet. 43, 1228–1231 (2011). [DOI] [PubMed] [Google Scholar]
- Zhong H. & Prentice R. L. Bias-reduced estimators and confidence intervals for odds ratios in genome-wide association studies. Biostatistics 9, 621–634 (2008). [DOI] [PMC free article] [PubMed] [Google Scholar]
- Kirchhoff T. et al. The 6q22.33 locus and breast cancer susceptibility. Cancer. Epidemiol. Biomarkers. Prev. 18, 2468–2475 (2009). [DOI] [PMC free article] [PubMed] [Google Scholar]
- Peter I. et al. Evaluation of 22 genetic variants with Crohn’s disease risk in the Ashkenazi Jewish population: a case-control study. BMC Med. Genet. 6, 63 (2011). [DOI] [PMC free article] [PubMed] [Google Scholar]
- Behar D. M. et al. The matrilineal ancestry of Ashkenazi Jewry: portrait of a recent founder event. Am. J. Hum. Genet. 78, 487–497 (2006). [DOI] [PMC free article] [PubMed] [Google Scholar]
- Palamara P. F., Lencz T., Darvasi A. & Pe’er I. Length distributions of identity by descent reveal fine-scale demographic history. Am. J. Hum. Genet. 91, 809–822 (2012). [DOI] [PMC free article] [PubMed] [Google Scholar]
- Teo Y. Y. et al. Power consequences of linkage disequilibrium variation between populations. Genet. Epidemiol. 33, 128–135 (2009). [DOI] [PMC free article] [PubMed] [Google Scholar]
- Gusev A. et al. The architecture of long-range haplotypes shared within and across populations. Mol. Biol. Evol. 29, 473–486 (2011). [DOI] [PMC free article] [PubMed] [Google Scholar]
- Guha S. et al. Implications for health and disease in the genetic signature of the Ashkenazi Jewish population. Genome. Biol. 13, R2 (2012). [DOI] [PMC free article] [PubMed] [Google Scholar]
- Laaksovirta H. et al. Chromosome 9p21 in amyotrophic lateral sclerosis in Finland: a genome-wide association study. Lancet. Neurol. 9, 978–985 (2010). [DOI] [PMC free article] [PubMed] [Google Scholar]
- Jakkula E. et al. Genome-wide association study in a high-risk isolate for multiple sclerosis reveals associated variants in STAT3 gene. Am. J. Hum. Genet. 86, 285–291 (2010). [DOI] [PMC free article] [PubMed] [Google Scholar]
- First M. B., Spitzer R. L., Gibbon M. & Williams J. B. W. Structured Clinical Interview for DSM-IV-TR Axis I Disorders, Research Version, Patient Edition. (SCID-I/P) Biometrics Research, New York State Psychiatric Institute (1994). [Google Scholar]
- Purcell S. et al. PLINK: a tool set for whole-genome association and population-based linkage analyses. Am. J. Hum. Genet. 81, 559–575 (2007). [DOI] [PMC free article] [PubMed] [Google Scholar]
- Nyholt D. R. A simple correction for multiple testing for single-nucleotide polymorphisms in linkage disequilibrium with each other. Am. J. Hum. Genet. 74, 765–769 (2004). [DOI] [PMC free article] [PubMed] [Google Scholar]
- Kang H. M. et al. Variance component model to account for sample structure in genome-wide association studies. Nat. Genet. 42, 348–354 (2010). [DOI] [PMC free article] [PubMed] [Google Scholar]
- Howie B. N., Fuchsberger C., Stephens M., Marchini J. & Abecasis G. R. Fast and accurate genotype imputation in genome-wide association studies through pre-phasing. Nat. Genet. 44, 955–959 (2012). [DOI] [PMC free article] [PubMed] [Google Scholar]
- Howie B. N., Donnelly P. & Marchini J. A flexible and accurate genotype imputation method for the next generation of genome-wide association studies. PLoS Genet. 5, e1000529 (2009). [DOI] [PMC free article] [PubMed] [Google Scholar]
- The CARDIoGRAMplusC4D Consortium. Large-scale association analysis identifies new risk loci for coronary artery disease. Nat. Genet. 45, 25–33 (2013). [DOI] [PMC free article] [PubMed] [Google Scholar]
- Nyholt D. R. et al. Genome-wide association meta-analysis identifies new endometriosis risk loci. Nat. Genet. 44, 1355–1359 (2012). [DOI] [PMC free article] [PubMed] [Google Scholar]
- Zhang D. et al. Genetic control of individual differences in gene-specific methylation in human brain. Am. J. Hum. Genet. 86, 411–419 (2010). [DOI] [PMC free article] [PubMed] [Google Scholar]
- Johnson W. E., Li C. & Rabinovic A. Adjusting batch effects in microarray expression data using empirical Bayes methods. Biostatistics 8, 118–127 (2007). [DOI] [PubMed] [Google Scholar]
- Leek J. T. & Storey J. D. Capturing heterogeneity in gene expression studies by surrogate variable analysis. PLoS Genet. 3, 1724–1735 (2007). [DOI] [PMC free article] [PubMed] [Google Scholar]
Associated Data
This section collects any data citations, data availability statements, or supplementary materials included in this article.
Supplementary Materials
Supplementary Figures S1-S6, Supplementary Note 1 and Supplementary References
List of genome-wide SNPs achieving logistic regression (additive model) p-values > 10-4
Effects in the discovery cohort for SNPs achieving genome-wide significance in prior large-scale GWAS studies for schizophrenia or bipolar disorder.


