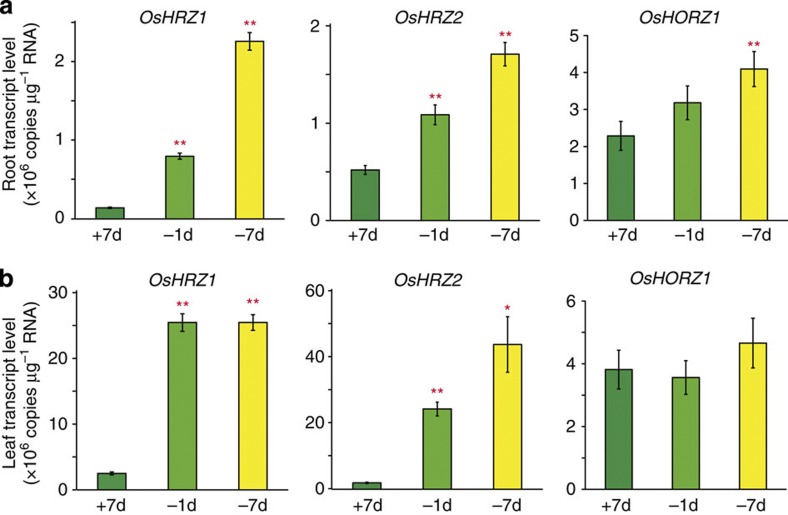
Figure 2. Expression levels of HRZ and HORZ.
The transcript levels of OsHRZ1, OsHRZ2 and OsHORZ1 were quantified by RT–PCR in roots (a) and leaves (b) of hydroponically grown wild-type rice. +7d, Fe sufficiency for 7 days; −1d, Fe deficiency for 1 day; −7d, Fe deficiency for 7 days. Means±s.d. of three technical replicates derived from one biological replicate are shown. Asterisks indicate significant differences from the +7-day value (two-sample Student’s t-test; *P<0.05; **P<0.01; Supplementary Table S1).

