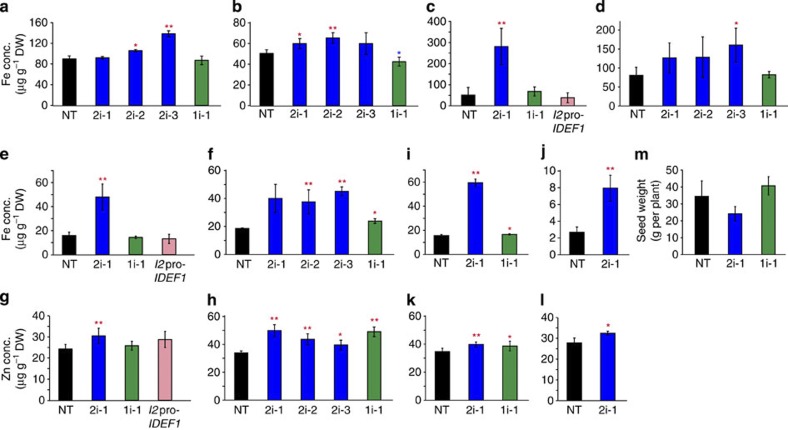
Figure 5. Fe and Zn accumulation in shoots and seeds of the HRZ-knockdown plants.
(a and b) Fe concentration in leaves subjected to Fe-sufficient (a) or Fe-deficient (b) hydroponic treatment for 7 days. (c and d) Fe concentrations in straws at harvest from pot culture in calcareous (c) or normal (d) soil. (e and f) Fe concentrations in brown seeds from pot culture in calcareous (e) or normal (f) soil. (g and h) Zn concentrations in brown seeds from pot culture in calcareous (g) or normal (h) soil. (i and j) Fe concentrations in brown (i) or polished (j) seeds from field cultivation in normal soil. (k and l) Zn concentrations in brown (k) or polished (l) seeds from field cultivation in normal soil. The Fe and Zn concentrations are shown as means±s.d. of μg g−1 dry weight (DW) of three to eight replicates derived from three to four biological replicates. (m) Yields from field cultivation in normal soil, shown as seed weight per plant (means±s.d. of three biological replicates). NT, non-transformant; 2i-1, 2i-2 and 2i-3, HRZ2i lines 1, 2 and 3, respectively; 1i-1, HRZ1i line 1; I2pro-IDEF1, IDEF1 induction line 13. Asterisks indicate significant differences compared with NT (two-sample Student’s t-test; *P<0.05; **P<0.01; Supplementary Table S1).

