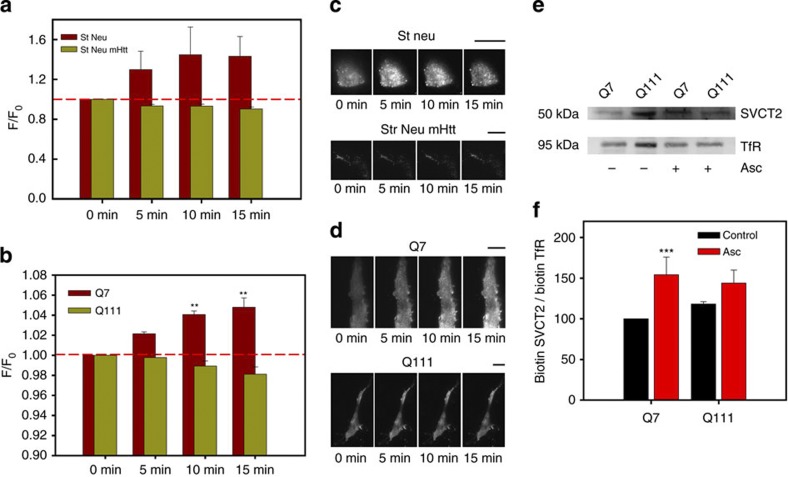
Figure 4. Extracellular ascorbic acid preincubation induces translocation of SVCT2 to the plasma membrane.
(a,b) Bar plots for normalized fluorescence intensity obtained from TIRF microscopy images in primary cultures of striatal neurons expressing SVCT2-EGFP (St Neu), mHtt-DsRED (St Neu mHtt), Q7 and Q111 cells expressing SVCT2-EGFP. Analysis of variance (ANOVA) followed by the Bonferroni post-test, n=4 (Q cells, eight cells for every condition), n=3 (striatal neurons, six cells for every condition), **P<0.01. (c,d) TIRF microscopy images for SVCT2-EGFP showing a representative striatal neuron or Q cell. Data represent the mean±s.d. of eight cells. Scale bars are 10 μm. (e) Western blot analyses of biotinylated proteins from Q7 and Q111 cells. Where indicated, cells were preincubated with 1 mM ascorbic acid for 10 min prior to the biotinylation assay. Full unedited blot including molecular weight markers is shown in Supplementary Figs S3 and S4. (f) Bar plots for densitometric scanning analysis of the SVCT2 western blot. Student’s t-test, n=4, ***P<0.001.

