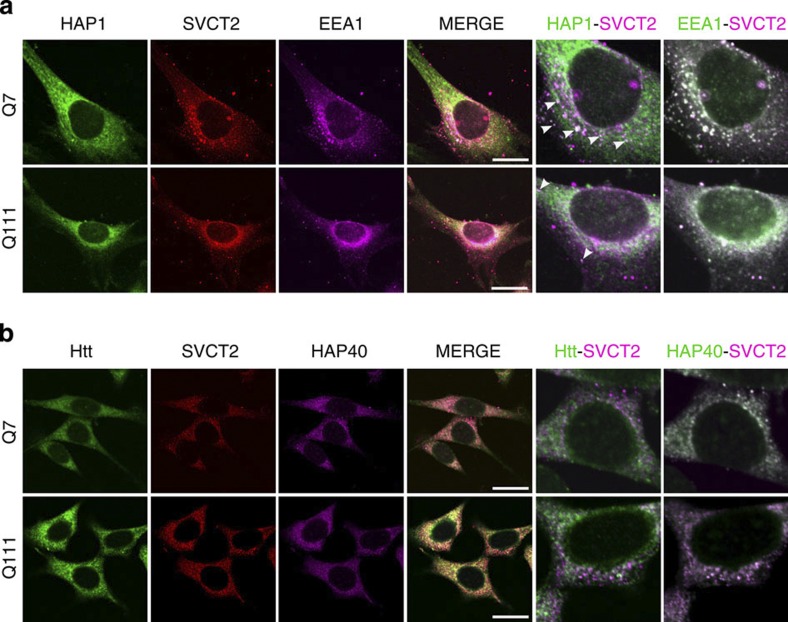
Figure 9. Colocalization of HAP1 and SVCT2 is disrupted in cells expressing mHtt.
(a) Immunofluorescence analyses in Q7 and Q111 cells for HAP1 (green), SVCT2 (red) and EEA1 (magenta). To best appreciate colocalization of HAP1-SVCT2 and EEA1-SVCT2, images to the right are shown in magenta and green. (b) Immunofluorescence analyses in Q7 and Q111 cells for Htt (green), SVCT2 (red) and HAP40 (magenta). To best appreciate colocalization of Htt-SVCT2 and HAP40-SVCT2, images to the right are shown in magenta and green. Arrowheads indicate areas of colocalization. Scale bars are 20 μm.

