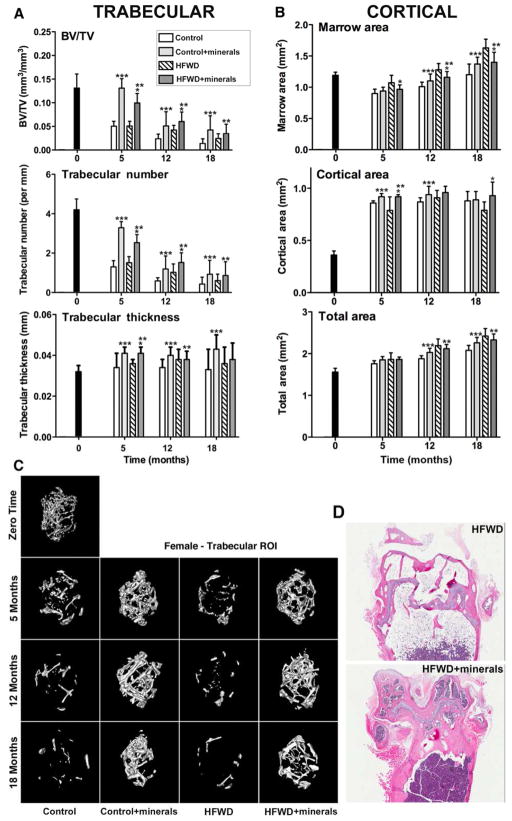
Figure 1. Structural features of femoral bone.
A: Trabecular/B: Cortical μ-CT parameters: Data are based on 5 mice at baseline (3 weeks of age), 10 mice at 5 and 12 months and 15 mice at 18 months in each diet group. Values are means and standard deviations. Statistical significance of each parameter was assessed by ANOVA followed by paired group comparisons. Statistical significance at the p<0.05 level is indicated by asterisks. * by the HFWD + minerals indicates statistically significant improvement relative to HFWD alone; ** by the HFWD + minerals indicates statistically significant improvement relative to control; *** by the control + minerals indicates statistically significant improvement relative to control. C: μ-CT images: A representative 3D μ-CT image of the trabecular region from the femur of a female mouse in each diet group is shown. D: Histological images: Hematoxylin and eosin-stained sections of decalcified bone (distal femoral condyles) from a mouse (at 18 months) in two high-fat diet groups are shown (Bars=200 μm).

