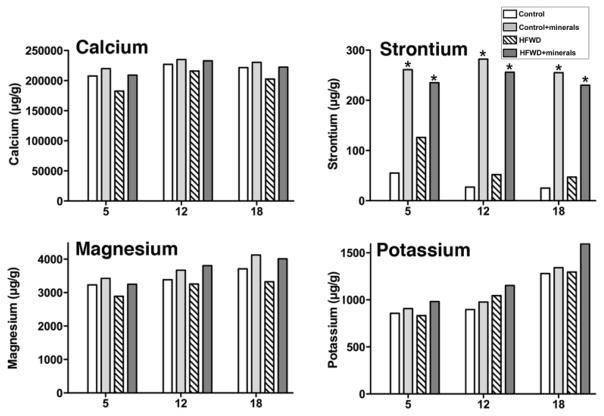
Figure 4. Strontium levels in bone; Comparison with calcium, magnesium and potassium.
Long bones from all mice in a group were pooled together, digested and analyzed by Inductively Coupled Plasma Optical Emission Spectrometry (ICP-OES) as one sample per diet group (10 mice per group at 5- and 12-months and 15 mice at 18-months). * is placed on diet groups with minerals and indicates statistically significant increase in the strontium level (using two-way factorial ANOVA) than the diet groups without minerals. (p<0.05)

