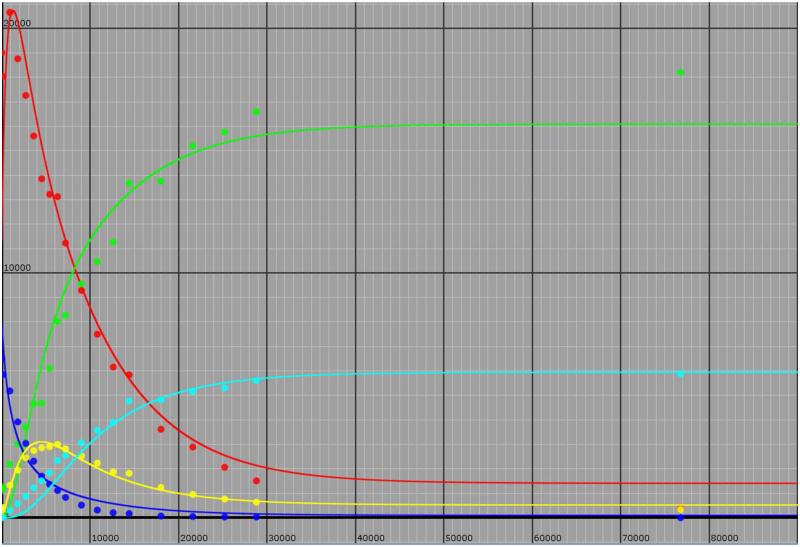
Figure 7.
“Global Simulation of Mass Spectrometry Data” The Model shown in Scheme 2 was used as was the KinTek Global Kinetic Explorer (Ver. 3.0.2362). Isotopic species are: all protio isocitrate (red), all protio succinate (blue), mono-deutero isocitrate (green), mono-deuterated succinate (yellow) and di-deutero succinate (light blue). The rate constants yielding the curves through the experimental points are: k1 = 9.53 × 10⁻⁵ s−1; k−1 = 2.33 x10⁻⁴ s−1; k2 = 3.83 × 10⁻⁴ s−1; k−2 = 2.83 × 10⁻⁴ s−1; k3 = 3.43 × 10⁻⁵ s−1; k−3 = 4.05 × 10⁻⁵ s−1; k4 = 3.83 × 10⁻⁵ s−1; k−4 = 2.83 × 10⁻⁴ s−1.

