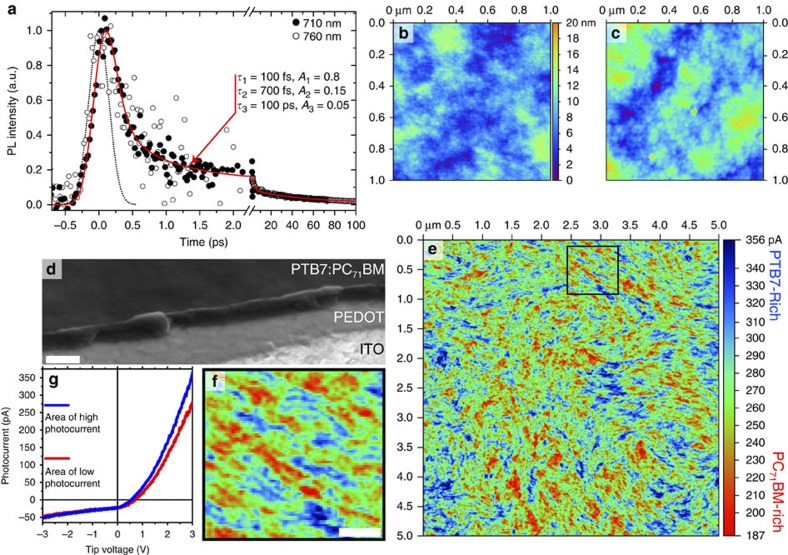
Figure 4. Results of PTB7:PC71BM blends prepared with 3% DIO.
(a) Ultrafast fluorescence dynamics recorded at 710 nm (closed circles) and 760 nm (open circles), representing fullerene emission. The best fit to the data (red line) gives decay time constants of 100 fs representing 80% of the amplitude and 700 fs representing 15%. A significantly slower 100-ps decay is observed to make up the remaining 5% of amplitude and is measured with a streak camera. The instrument response function for the decay up to 2 ps is shown as a dotted line and is 350-fs full-width half-maximum. Shown in b is the topography measured with AFM of the sample as made and in (c) after removing ~20 nm of material with plasma-ashing. The z-scale shown between the two panels is common to both topographies. In d an SEM image of the blend is shown, viewed from an angle of 52° with a score made across the film, enabling the ITO, PEDOT and blend to be imaged in profile, where the white scale bar is 500 nm. (e) Photoconductive–AFM image of a 5 × 5 μm window under 670 nm excitation with +3 V tip bias, the z-scale is photocurrent in units of picoamps. High photocurrent (blue) indicates regions that are polymer-rich, with low photocurrent (red) indicating fullerene-rich regions. Shown in f is a close-up of the black square from e, looking at the morphology of the two materials in detail, the white scale bar is 200 nm. (g) Photocurrent–voltage characteristics for a typical region of high (blue line) and low (red line) photocurrent.

