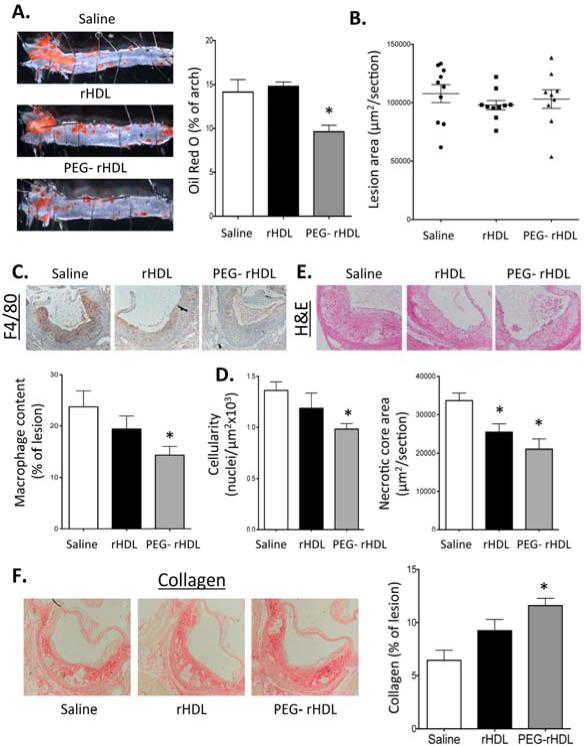
Figure 5. Quantification of aortic atherosclerosis lesions.
Apoe−/− mice fed a WTD for 8 weeks were infused with rHDL or PEG-rHDL 40mg/kg weekly for two weeks. 7 days post the second infusion, the mice were euthanized lesion characteristics were analyzed. (A) The percentage of the aortic arch stained with Oil-Red O. (B) Lesion area in the proximal aorta. (C) Macrophage content as assessed by F4/80 staining in the proximal aorta. (D) Cellularity of the lesions in the proximal aorta determined by nuclei/area. (E) Necrotic core size from H&E stained sections of the proximal aorta. (F) Collagen staining in the proximal aorta by picrosirius red. Data are presented as mean ± SEM, n=10/group. *P<0.05 vs Saline.

