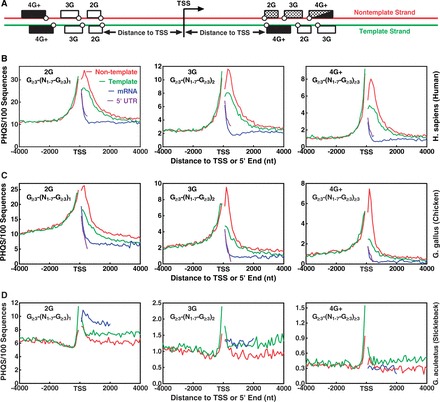
Figure 2.

Distribution of putative DNA:RNA HQ-forming sequences (PHQS) with different numbers of G-tracts in the ±4 kb region of TSS. (A) Scheme of PHQS distribution. Dotted block: motifs capable of forming HQ (the 4G+ may also form non-hybrid intramolecular G-quadruplexes); filled block: capable of forming intramolecular G-quadruplex; open block: unable to form either HQ or intramolecular G-quadruplex. Open circle indicates the coordinate of G-tract (the first guanine). (B) Human, 22 058 genes, (C) Chicken, 16 736 genes, (D) Stickleback, 20 787genes. Matching pattern is indicated in each panel. Color designation for the curves in the first panel of human also applies to all the other panels (same in the whole paper). Frequency was normalized to the number of sequences and expressed as the number of occurrences in 100 sequences within a 100-nt window.
