
Figure 3.
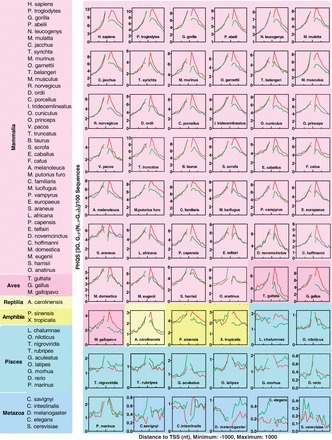
Biased selection of PHQS in 60 species in the Ensembl database. Each panel shows the occurrence of PHQS with three G-tracts (3G) in the non-template (red curve) and template (green curve) strands within the ±1-kb region centered at TSS. Similar distribution pattern and strand bias were also present for PHQS with two and four G-tracts (2G and 4G+) as in Figure 2. The species list is ordered according to the species tree provided on the Ensembl Web site to reflect the order of evolution.