
Figure 4.
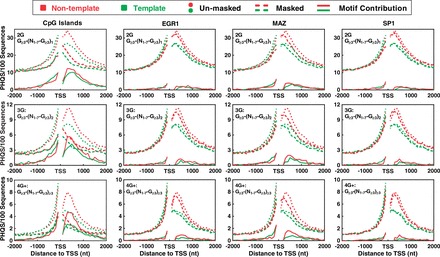
Contribution of CpG islands and G-rich TFBSs (EGR1, MAZ and SP1) to the enrichment and strand bias of PHQS near TSS. DNA sequences were searched for PHQS motifs before (dotted curves) and after (dashed curves) masking the correspondent motif. The difference between the two searches gave the contribution of the motif. Results were processed and expressed as in Figure 2. Red and green curves indicate non-template and template DNA strand, respectively.