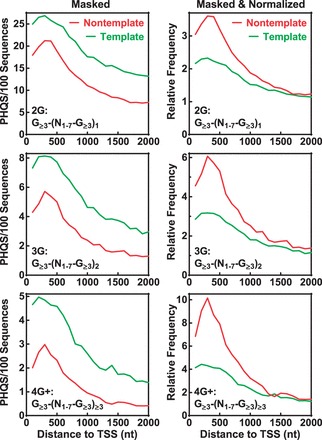
Figure 5.

Contribution of hnRNP A and H to the enrichment and strand bias of PHQS downstream of TSS. Four G-rich motifs were masked in the following order: TAGGGT/A, GGGA, only on the non-template strand. Frequency is expressed as in Figure 2. Left panels: original data obtained after masking. Right panels: data obtained by normalizing the original data to the background (mean of the data points in the 3000–4000 nt region) of each curve. Red and green curves indicate non-template and template DNA strand, respectively.
