Figure 1.

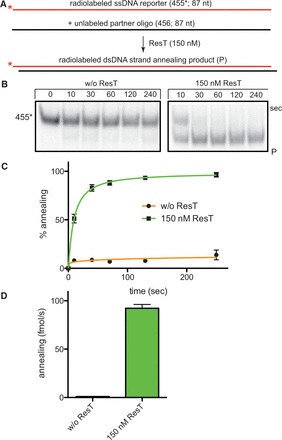
ResT promotes DNA SSA. (A) Schematic representation of the SSA assay. The tested DNA strands anneal into an 83-bp duplex product with 26% GC-content typical of the low GC-content of the B. burgdorferi genome. The 5′-32P endlabeled 455* reporter strand is shown as a shaded or red line, whereas the complementary unlabeled 456 strand is shown in black. Also, represented is the 83-bp heteroduplex product (SSA). The red asterisk represents the 5′-32P endlabel. (B) Nine percent native TAE–SDS PAGE analysis of SSA promoted by ResT. Representative panels of SSA time courses are shown. The migration position on the gel of the labeled reporter strand (455*) is indicated to the left, whereas the migration position of the duplex product of annealing (P) is indicated on the right. Gels were run at 13 V/cm for 150 min. (C) Graphical summary of SSA time courses. The mean and standard deviation of at least three independent experiments are shown; without (w/o) ResT (N = 3) and 150 nM ResT (N = 4). (D) Comparison of the initial rates of spontaneous and ResT-promoted SSA of the 455* and 456 strands detailed in (A); w/o ResT (N = 3) and 150 nM ResT (N = 4).
