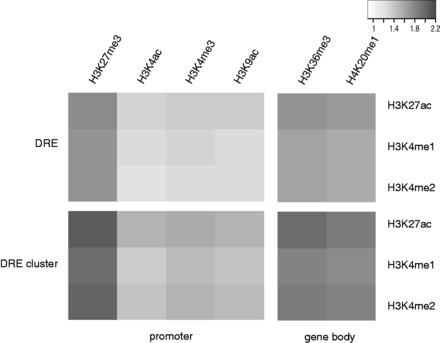
Figure 5.

The enrichment of histone modification patterns among predicted DRE–target gene pairs. The observed-to-expected ratios of the combination of the histone modifications at DRE and at gene promoter or gene body among predicted DRE–target gene pairs (A) or among predicted DRE cluster–target gene pairs (B) are shown in the black and white heatmaps. The intensity of the black color corresponds to the observed-to-expected ratio. The analysis is performed on IMR90 cell line. The result of h1ESC is similar, and is shown in Supplementary Figure S7.
