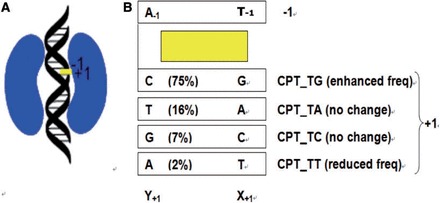
Figure 1.

(A) Schematic diagram of a Top1-DNA-inhibitor ternary complex. Top1, DNA and CPT are shown in kidney-, helix- and rectangle-shape, respectively. (B) Schematic diagram of the CPT at the cleavage site, with its flanking base pairs. The frequencies of base sequences observed in CPT-induced DNA cleavage in SV40 DNA are given in parenthesis. Experimental base frequencies revealed that base frequencies at DNA cleavage sites was significantly (99.9% confidence interval) enhanced at the TG cleavage site in the presence of CPT, but no significant preference was seen for the TA and TC cleavage sites. The action of CPT was almost abolished at the TT cleavage site. Its base frequency was significantly (99.9% confidence interval) reduced in the presence of CPT.
