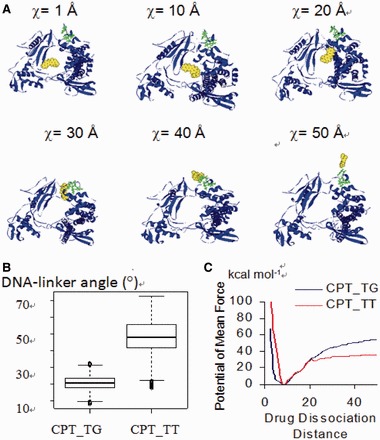
Figure 6.

(A) Snapshots of the ternary complex as the drug dissociate from the cleavage complex. The CPT and the three Trp203/205/206 residues in the NH2-terminal of Top1 are shown in CPK and ball and stick styles, respectively; the DNA strands are not shown for the ease of visualization. (B) Angles formed between DNA and the linker domain of the complexes during the drug dissociation process. (C) The PMF of CPT_TG complex is higher than that of the CPT_TT complex.
