
Figure 5.
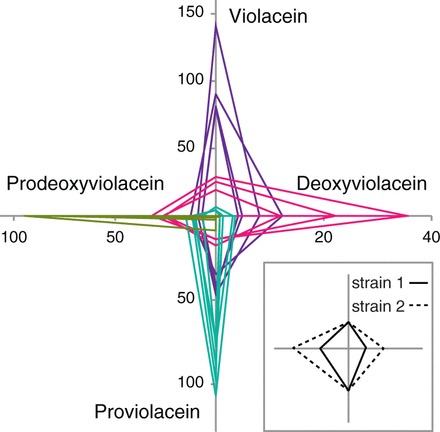
Strains with directed flux. The top five predicted combinations for each product and their associated relative titers. The five predictions for a given product are grouped by color: purple for violacein, pink for deoxyviolacein, teal for proviolacein, green for prodeoxyviolacein. Each predicted group shows preferential production of one product over the other three. Axes are relative product titer (HPLC peak area) in arbitrary units; each point is an average of four biological replicates (error bars not shown for clarity, but values are provided in Supplementary Table S6). Each closed loop represents a single strain, and the vertices indicate the titers of the four products. For example, strain 1 (solid line) produces equal amounts of violacein and proviolacein as strain 2 (dotted line) but half as much deoxyviolacein and prodeoxyviolacein (inset).