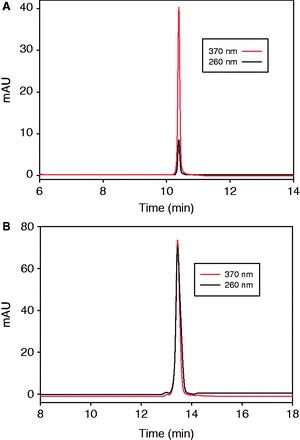
Figure 3.

Calculation of  and
and  via RP-HPLC analysis. (A) HPLC profile of 3′-SeUMP at 260 nm (solid line) and 370 nm (dash line). (B) HPLC profile of 5′-SeUU-3′ dimer at 260 nm (solid line) and 370 nm (dash line). The samples (3′-SeUMP and 5′-SeUU-3′) were analyzed on a Welchrom XB-C18 column (4.6 × 250 mm, 5 μ) at a flow of 1.0 ml/min and with a linear gradient of 5–50% B in 20 min, with a retention time of 10.3 and 13.6 min, respectively. Buffer A: 10 mM TEAAc (pH 7.1); B: 50% acetonitrile in 10 mM TEAAc (pH 7.1).
