
Figure 2.
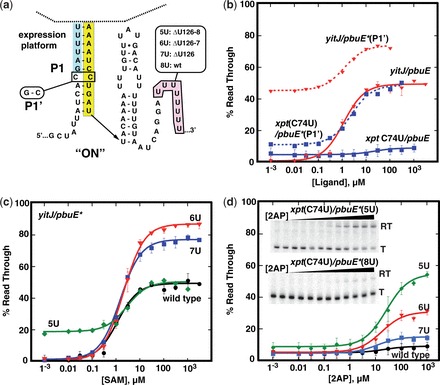
Optimizing performance of the pbuE* expression platform. (a) Secondary structure of the core switching region of the pbuE* expression platform with sites of mutations introduced. (b) Graphical representation of quantified data from in vitro transcription assays of the C31G mutation for yitJ and xpt(C74U) aptamers fused to pbuE* expression platform. (c) Quantified data from in vitro transcription as a function of SAM concentration of yitJ/pbuE* chimeras incorporating deletions of 0, 1, 2 or 3 uridines from the poly-uridine tract. (d) Quantified percentage read through transcription of xpt(C74U)/pbuE* chimeras as a function of 2AP concentration. The insets show two representative denature gels of transcription of chimeras with the wild-type expression platform (bottom) and the deletion of three uridines (top). The data plotted is the average of three independent experiments, and the error bars represent the uncertainty in the measurement.