
Figure 6.
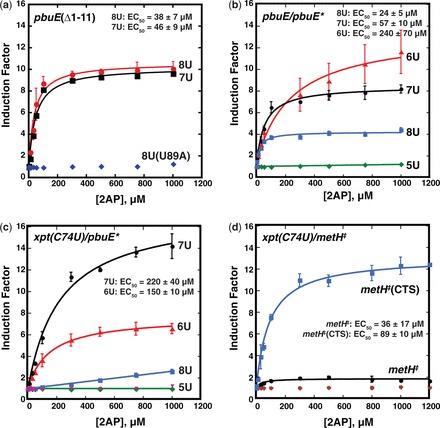
In vivo characterization of pbuE* and metH‡ chimeric riboswitches. (a) Quantification of induction of GFPuv expression as a function of 2AP concentration in a defined medium. The induction factor represents the fold increase in normalized GFP expression of the reporter under control of a riboswitch over the same riboswitch under no ligand conditions. Data was fit to a two-state model and plotted as a function of 2AP to yield the EC50. The U89A mutation (blue diamonds) is a mutant that is defective in 2AP binding as a negative control. (b) Induction of GFP expression by the pbuE/pbuE* chimera (‘8U’, blue) and uridine-rich tract mutations (5U, 6U and 7U). (c) The same series of experiments performed with xpt(C74U)/pbuE* chimeras. The pink triangles represent a U51C mutant of xpt(C74U)/pbuE* that is deficient in ligand binding. (d) Activity of the xpt(C74U)/metH chimera (black) and the ‘CTS’ mutant (blue). Nonbinding mutants are denoted in green and pink as negative controls. The data presented is the average of at least three independent experiments and the standard deviation of the average value is represented as the error bars.